Open Access
Fig. 16.
Download original image
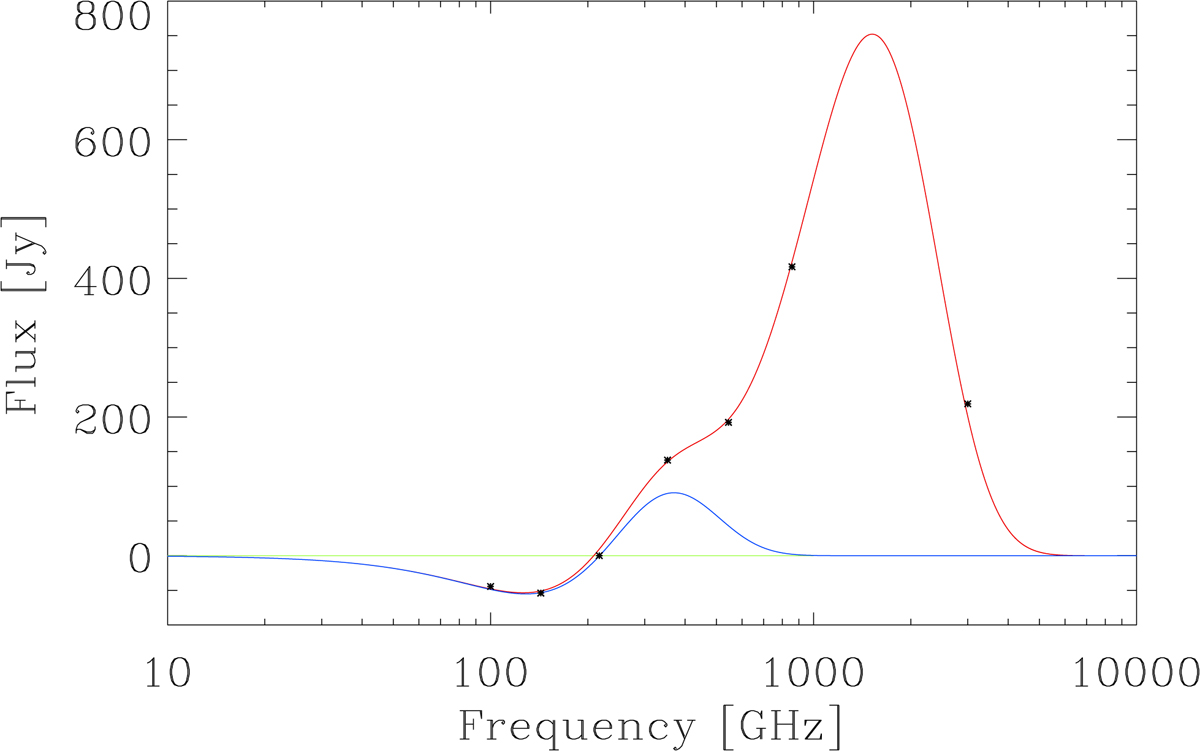
Stacked SED of galaxy-cluster candidates (black sample). The tSZ effect contribution is shown as a solid blue line, and the total SED accounting for tSZ and infra-red emission is shown as a solid red line.
Current usage metrics show cumulative count of Article Views (full-text article views including HTML views, PDF and ePub downloads, according to the available data) and Abstracts Views on Vision4Press platform.
Data correspond to usage on the plateform after 2015. The current usage metrics is available 48-96 hours after online publication and is updated daily on week days.
Initial download of the metrics may take a while.