Fig. 10.
Download original image
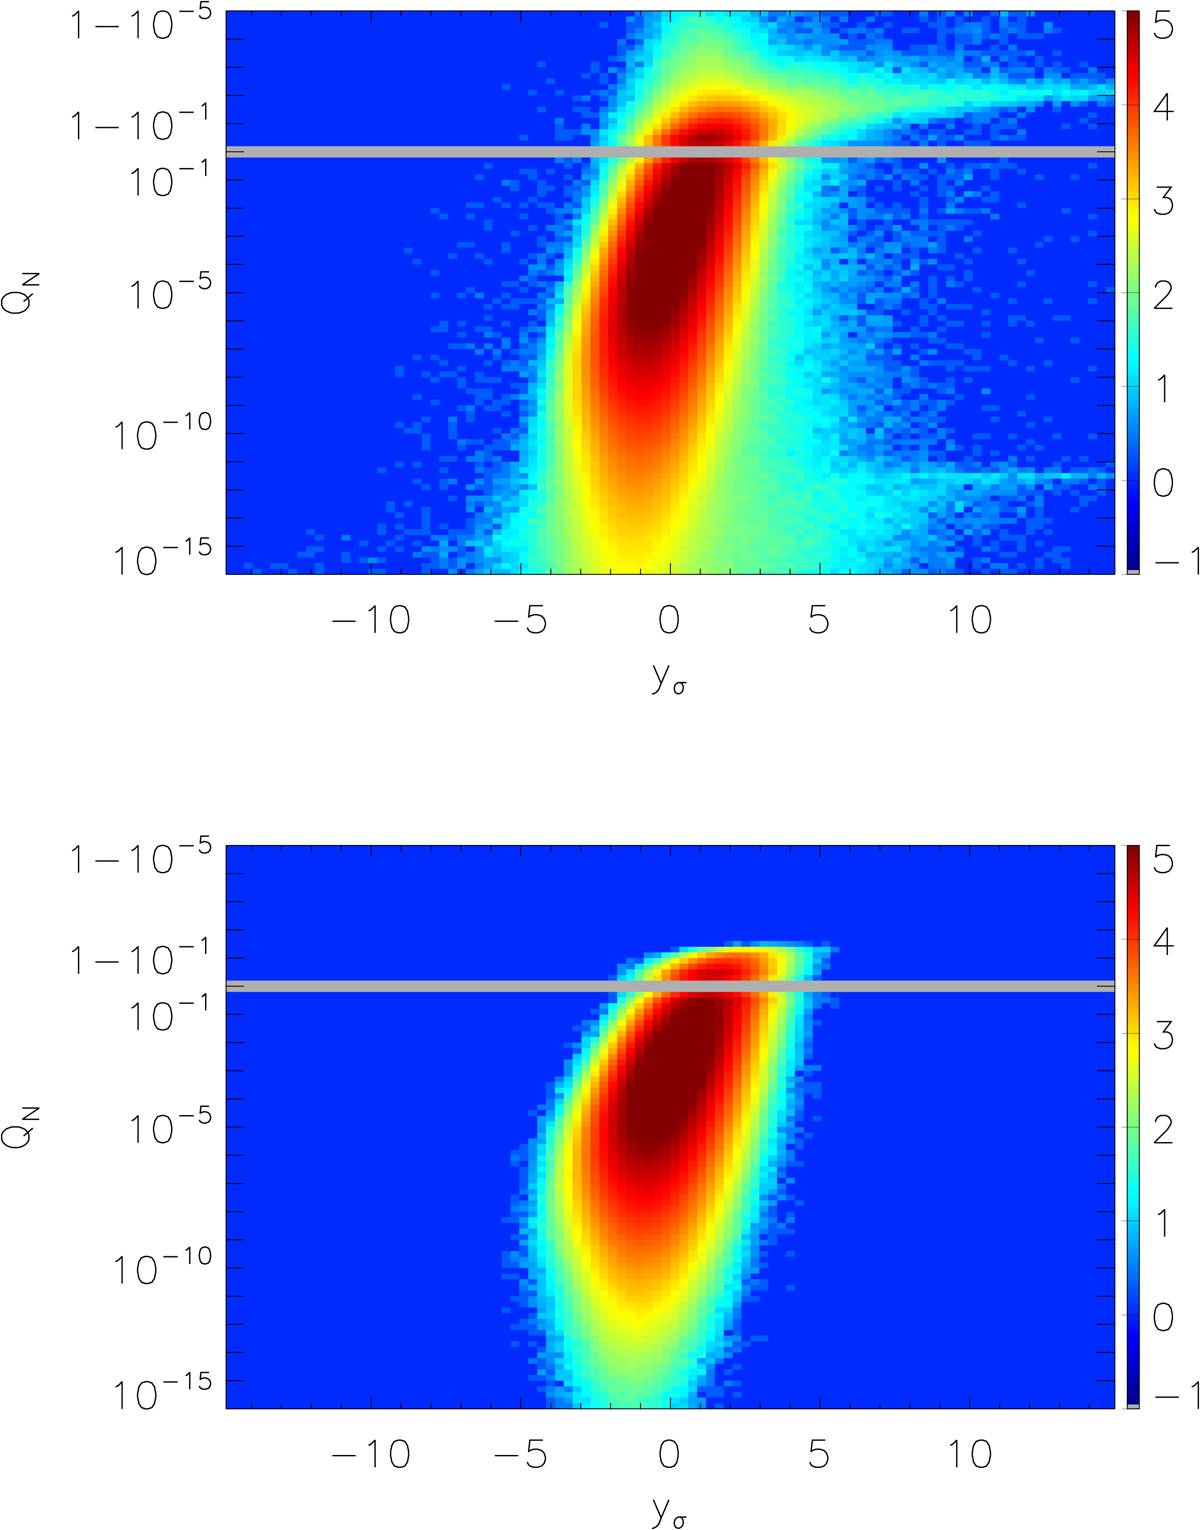
Distribution of the MILCANN map (top panel) and MILCANN noise simulation (bottom panel) pixels as a function of QN and normalized intensity, yσ. The colors show the number of pixels in logarithmic scale. To display the large dynamical range of the y axis, we divided the axis into two log scales with a “regular” log scale for small QN values and an “inverted” log scale for large QN values.
Current usage metrics show cumulative count of Article Views (full-text article views including HTML views, PDF and ePub downloads, according to the available data) and Abstracts Views on Vision4Press platform.
Data correspond to usage on the plateform after 2015. The current usage metrics is available 48-96 hours after online publication and is updated daily on week days.
Initial download of the metrics may take a while.