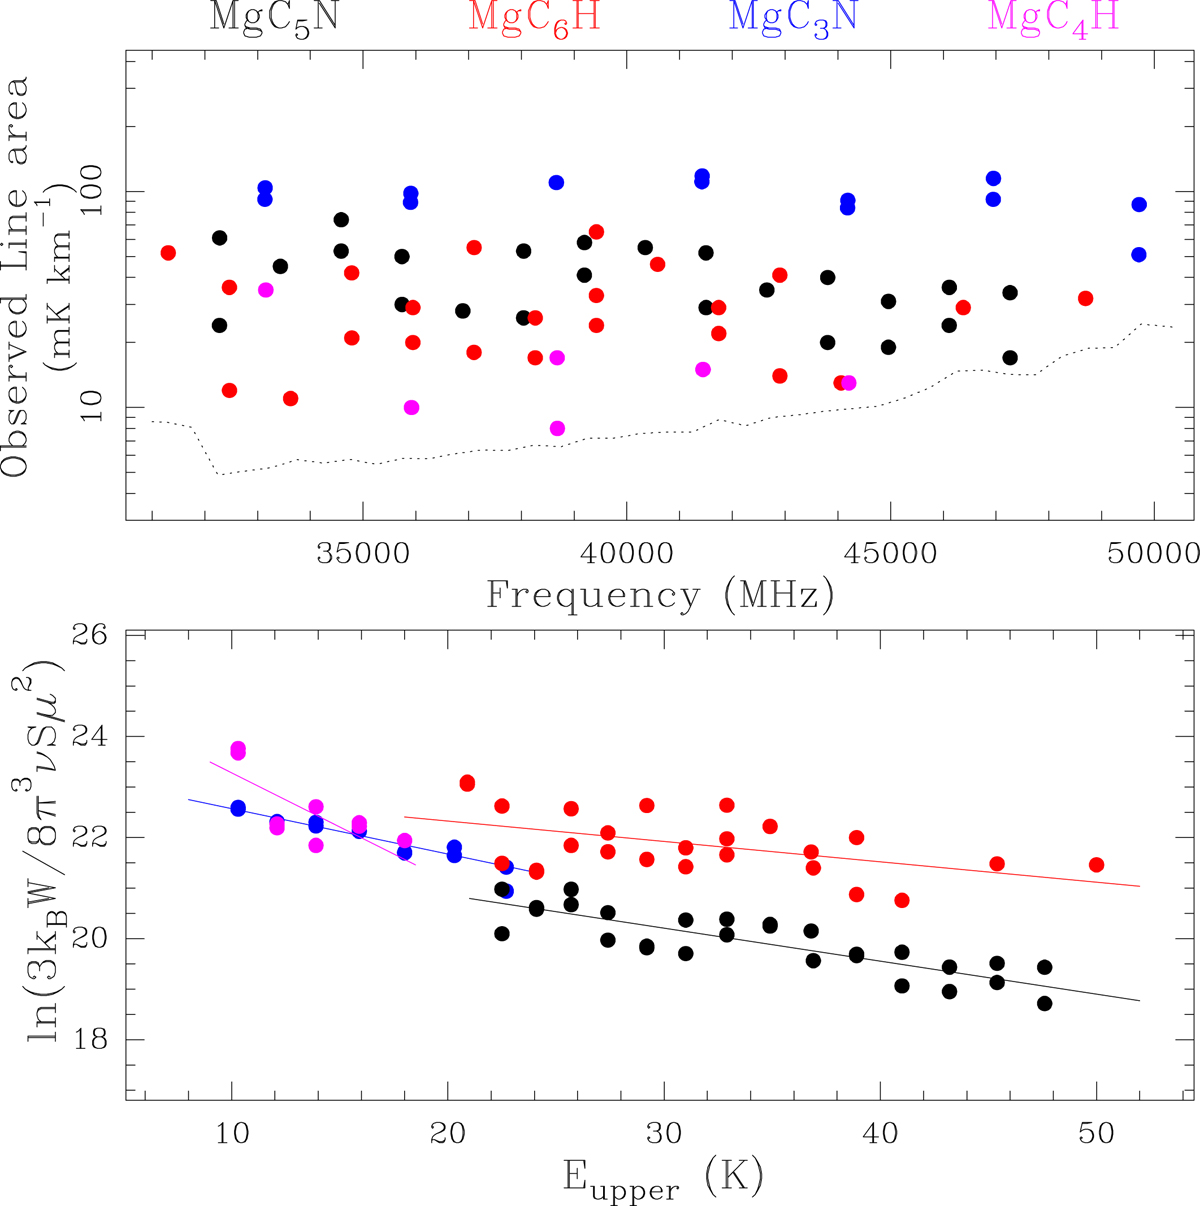
Fig. 1.
Download original image
Observed integrated line areas of MgC3N, MgC4H, MgC5N, and MgC6H toward IRC +10216 in the Q-band, and the rotational diagram for each molecule built from those integrated areas, together with the best fits that provide an estimation of their column densities and rotational temperatures. The dotted curve in the top panel is the noise level achieved in our survey across the whole frequency range. A few lines beyond 44 GHz are below the detectability limit and for this reason they do not appear in Table 1.
Current usage metrics show cumulative count of Article Views (full-text article views including HTML views, PDF and ePub downloads, according to the available data) and Abstracts Views on Vision4Press platform.
Data correspond to usage on the plateform after 2015. The current usage metrics is available 48-96 hours after online publication and is updated daily on week days.
Initial download of the metrics may take a while.