Fig. 9
Download original image
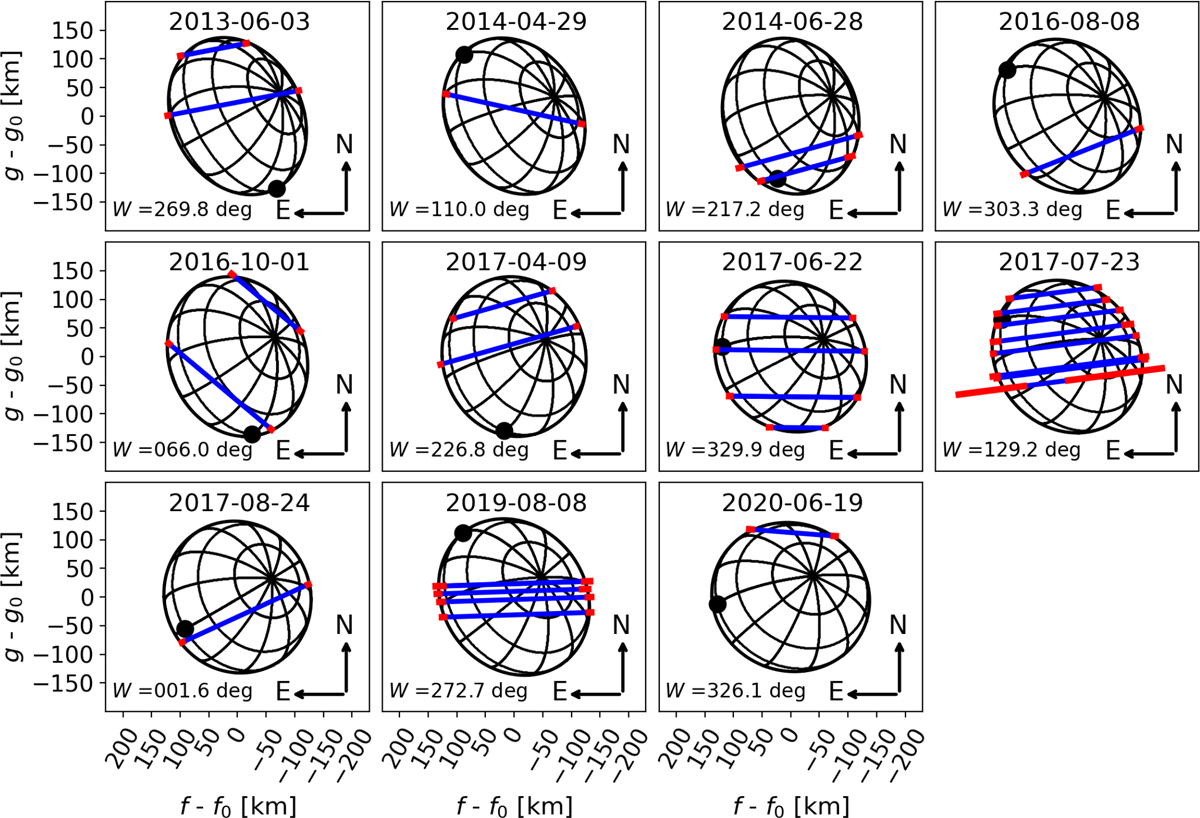
Ellipsoidal model that best fits the 11 stellar occultations observed between 2013 June 23 and 2020 June 19. Each panel corresponds to an occultation event identified by the time stamp. The blue lines stand for the observed chords with their uncertainties in red. The black dot indicates the intersection between the equator and the prime meridian, which is used as the reference to define the rotation angle W, indicated at the lower left.
Current usage metrics show cumulative count of Article Views (full-text article views including HTML views, PDF and ePub downloads, according to the available data) and Abstracts Views on Vision4Press platform.
Data correspond to usage on the plateform after 2015. The current usage metrics is available 48-96 hours after online publication and is updated daily on week days.
Initial download of the metrics may take a while.