Fig. F.1
Download original image
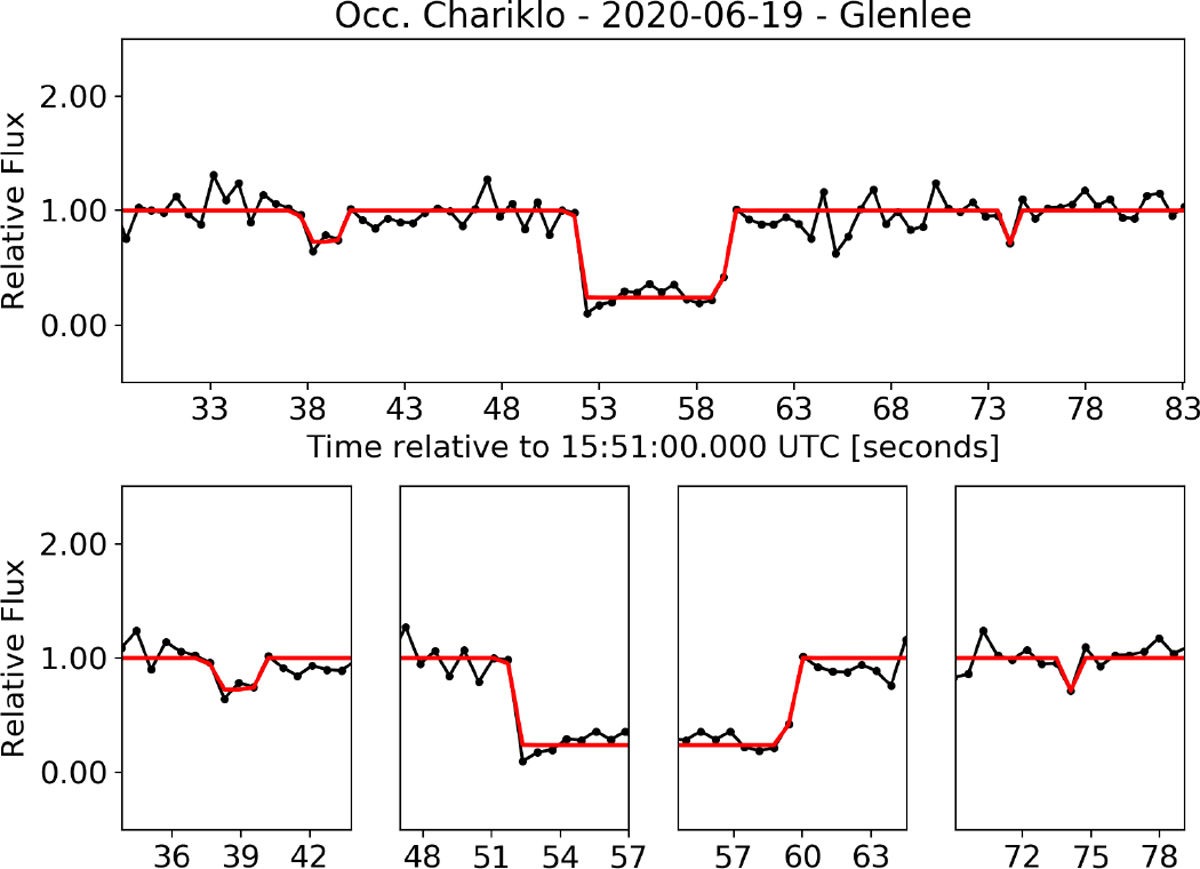
Light curve obtained in Glenlee on 2020 June 19. The event, date, and observer are indicated in the title and label. The upper panel contains the complete normalised light curve (black dots) and the fitted model (red line). The bottom panels contain zoomed-in views of a few seconds each centred on the detections of C1R, and the immersions and emersions behind the main body.
Current usage metrics show cumulative count of Article Views (full-text article views including HTML views, PDF and ePub downloads, according to the available data) and Abstracts Views on Vision4Press platform.
Data correspond to usage on the plateform after 2015. The current usage metrics is available 48-96 hours after online publication and is updated daily on week days.
Initial download of the metrics may take a while.