Open Access
Fig. E.1
Download original image
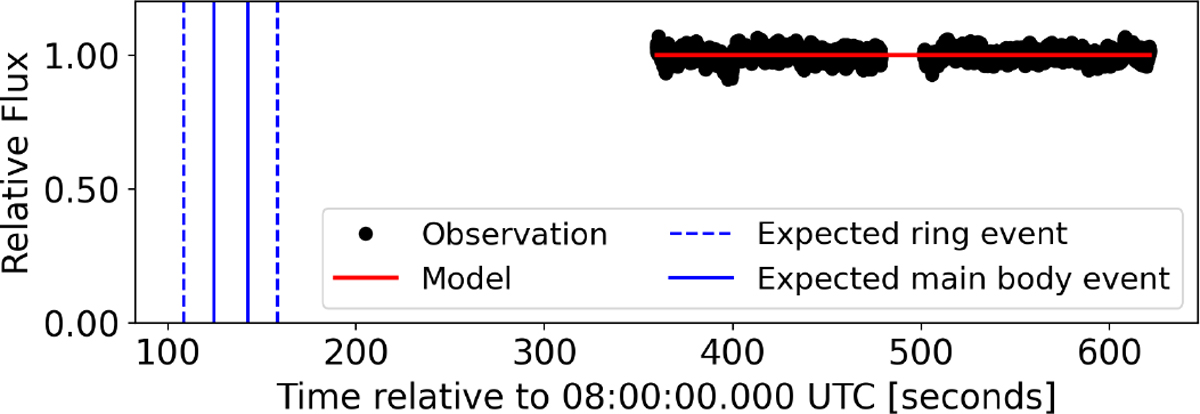
Light curve obtained at Gemini North on 2017 July 23. The solid blue vertical lines stand for the expected times for the main body occultation and the dashed lines for the expected times for the ring. The black points are the data points, which were taken in two blocks separated by a few seconds. See text for details.
Current usage metrics show cumulative count of Article Views (full-text article views including HTML views, PDF and ePub downloads, according to the available data) and Abstracts Views on Vision4Press platform.
Data correspond to usage on the plateform after 2015. The current usage metrics is available 48-96 hours after online publication and is updated daily on week days.
Initial download of the metrics may take a while.