Fig. 11
Download original image
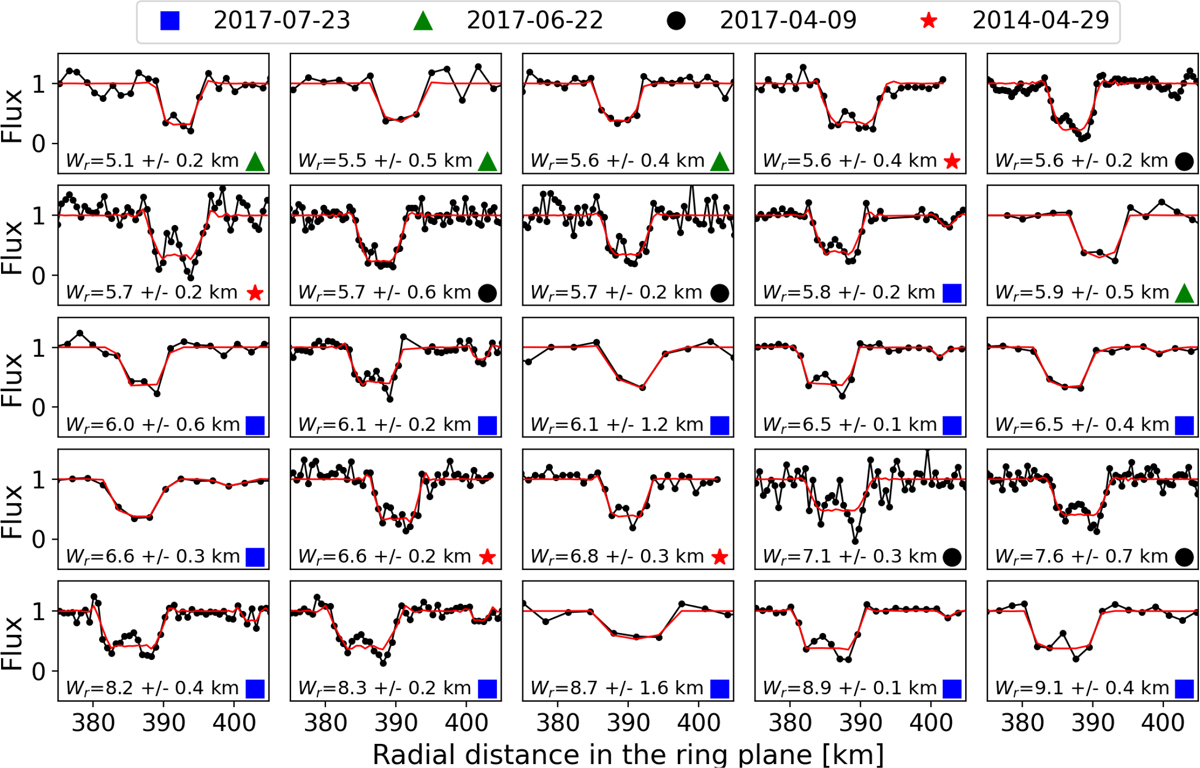
All resolved detections of Chariklo C1R over radial distance in the ring plane. The black dots represent the observed flux and the red line is the best-fit model. The detections were sorted by radial width, as written in the lower part of eachpanel. The symbols in the lower right corners of the panels represent the different occultations. The data and analysisof the 2014 April 29 occultation was obtained from Bérard et al. (2017).
Current usage metrics show cumulative count of Article Views (full-text article views including HTML views, PDF and ePub downloads, according to the available data) and Abstracts Views on Vision4Press platform.
Data correspond to usage on the plateform after 2015. The current usage metrics is available 48-96 hours after online publication and is updated daily on week days.
Initial download of the metrics may take a while.