Fig. 1
Download original image
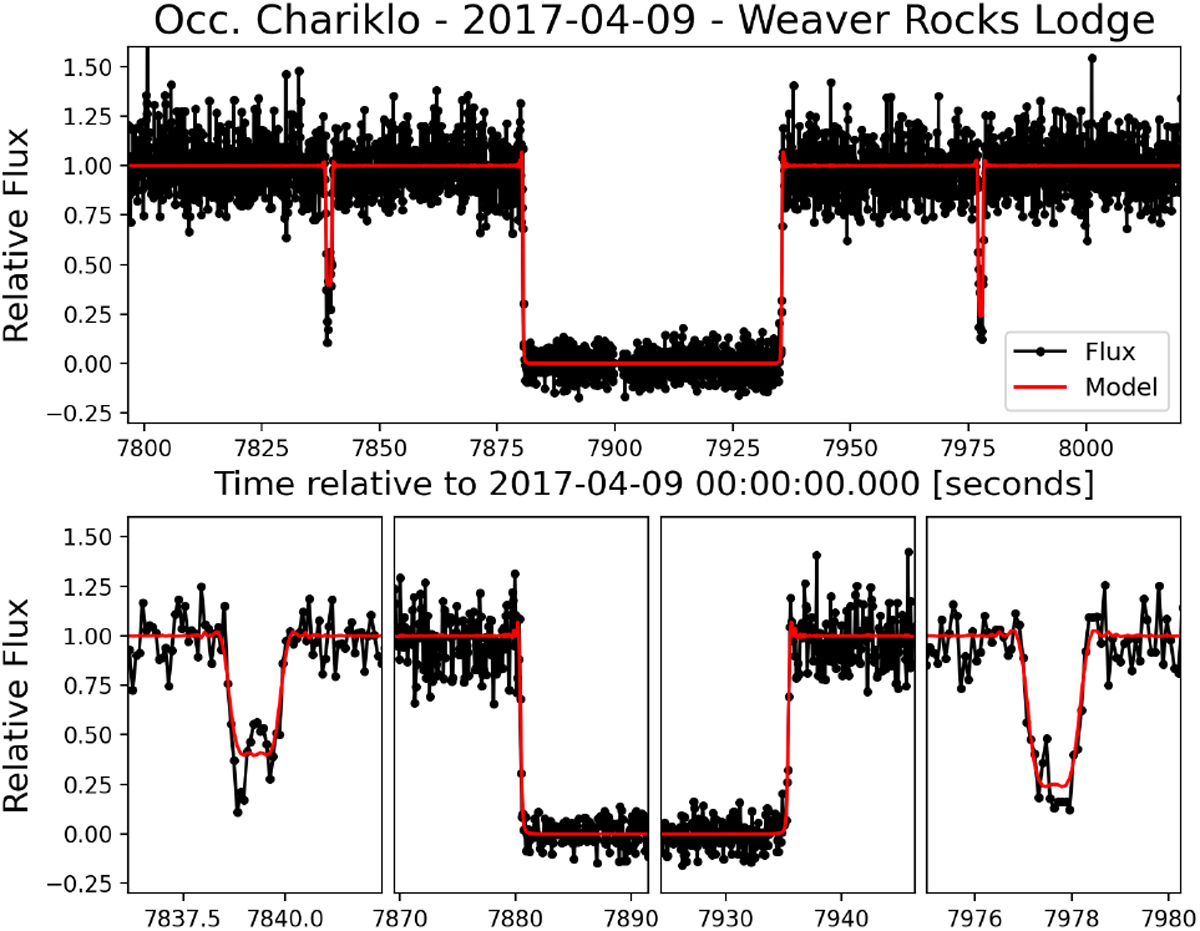
Normalised light curve obtained at Weaver Rocks Lodge on 2017 April 09. The black dots show the observational data, while the red lines represent the fitted model. Bottom panels: zoom-in on 20 s centred on the immersion and emersion times and 2.5 s centred in each C1R detection. In this dataset there is no clear detection of C2R. All the light curves used in this work can be found in Appendix F.
Current usage metrics show cumulative count of Article Views (full-text article views including HTML views, PDF and ePub downloads, according to the available data) and Abstracts Views on Vision4Press platform.
Data correspond to usage on the plateform after 2015. The current usage metrics is available 48-96 hours after online publication and is updated daily on week days.
Initial download of the metrics may take a while.