Free Access
Fig. 1.
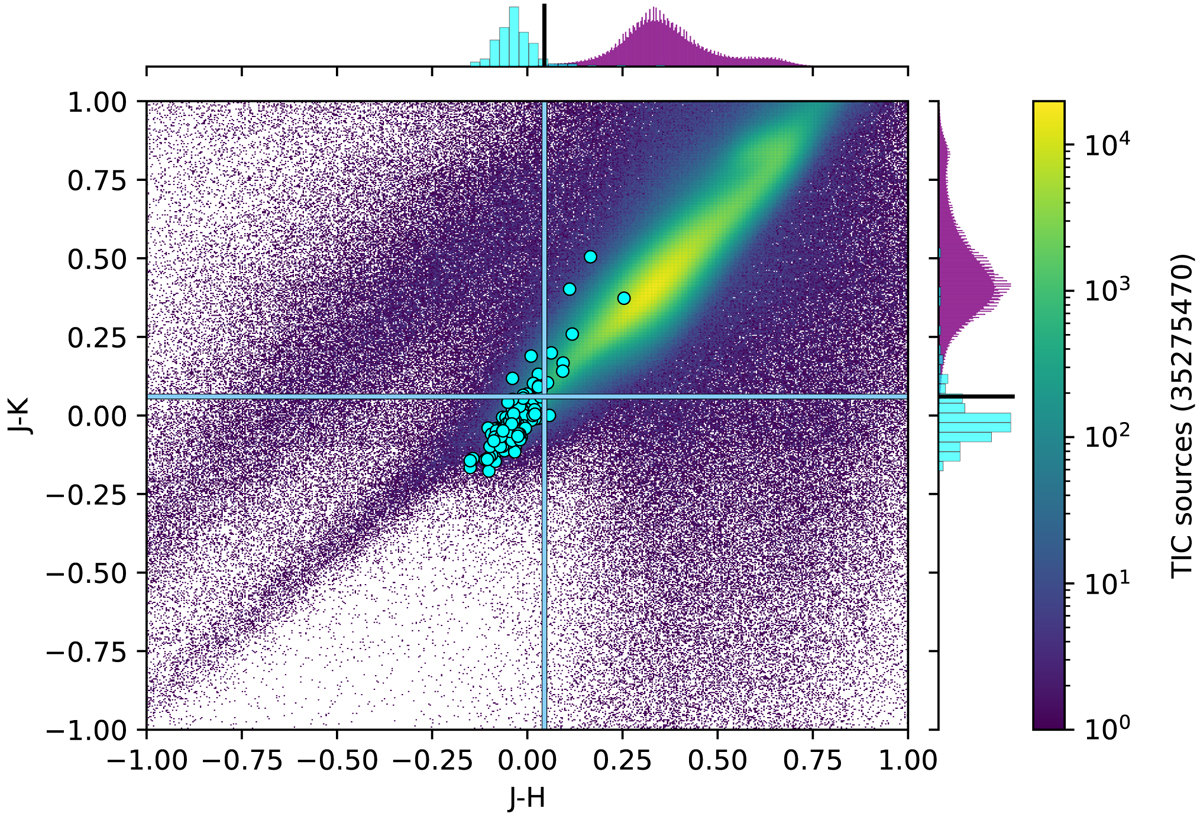
Colour–colour plot of the Pedersen et al. (2019) sample (cyan circles). The density plot in the background shows TIC targets brighter than 15th magnitude. The colour cuts are indicated by the horizontal and vertical lines. Only targets in the lower left quadrant are kept.
Current usage metrics show cumulative count of Article Views (full-text article views including HTML views, PDF and ePub downloads, according to the available data) and Abstracts Views on Vision4Press platform.
Data correspond to usage on the plateform after 2015. The current usage metrics is available 48-96 hours after online publication and is updated daily on week days.
Initial download of the metrics may take a while.