Fig. 7
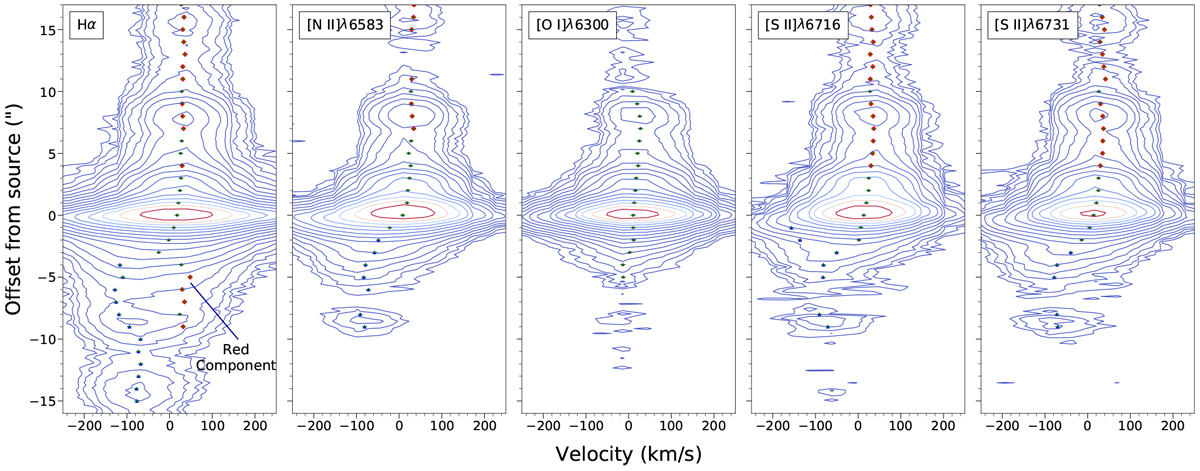
PV maps of selected jet emission lines with overplotted velocity centroids. Contours begin at the 4-σ level, with adjacent contours increasing as a factor of ![]() . Blue and red points indicate blue and red-shifted velocities, respectively, while black points indicate centroids within the central channel (approximately ±90 km s−1). A red-shifted component in the approaching Hα
jet is annotated.
. Blue and red points indicate blue and red-shifted velocities, respectively, while black points indicate centroids within the central channel (approximately ±90 km s−1). A red-shifted component in the approaching Hα
jet is annotated.
Current usage metrics show cumulative count of Article Views (full-text article views including HTML views, PDF and ePub downloads, according to the available data) and Abstracts Views on Vision4Press platform.
Data correspond to usage on the plateform after 2015. The current usage metrics is available 48-96 hours after online publication and is updated daily on week days.
Initial download of the metrics may take a while.