Free Access
Fig. 6
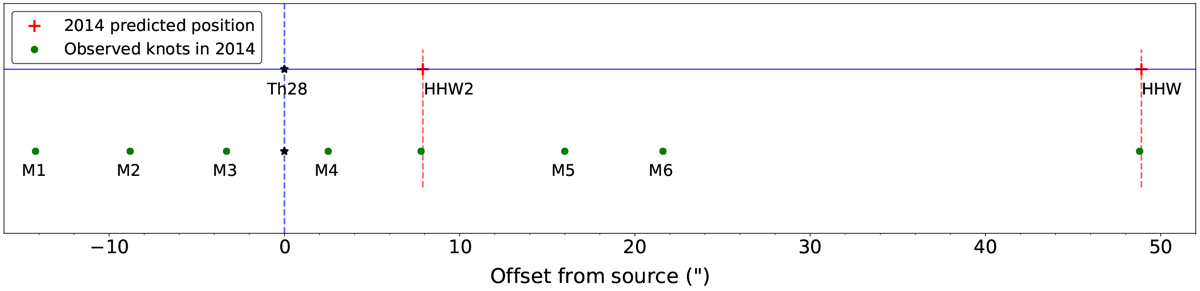
Knot positions along the jet axis within the FOV of our MUSE data (green dots). Also plotted are the predicted positions of HHW and HHW2 (red crosses) based on previous velocity and position measurements; these correspond almost perfectly with their positions in our observations.
Current usage metrics show cumulative count of Article Views (full-text article views including HTML views, PDF and ePub downloads, according to the available data) and Abstracts Views on Vision4Press platform.
Data correspond to usage on the plateform after 2015. The current usage metrics is available 48-96 hours after online publication and is updated daily on week days.
Initial download of the metrics may take a while.