Fig. 4
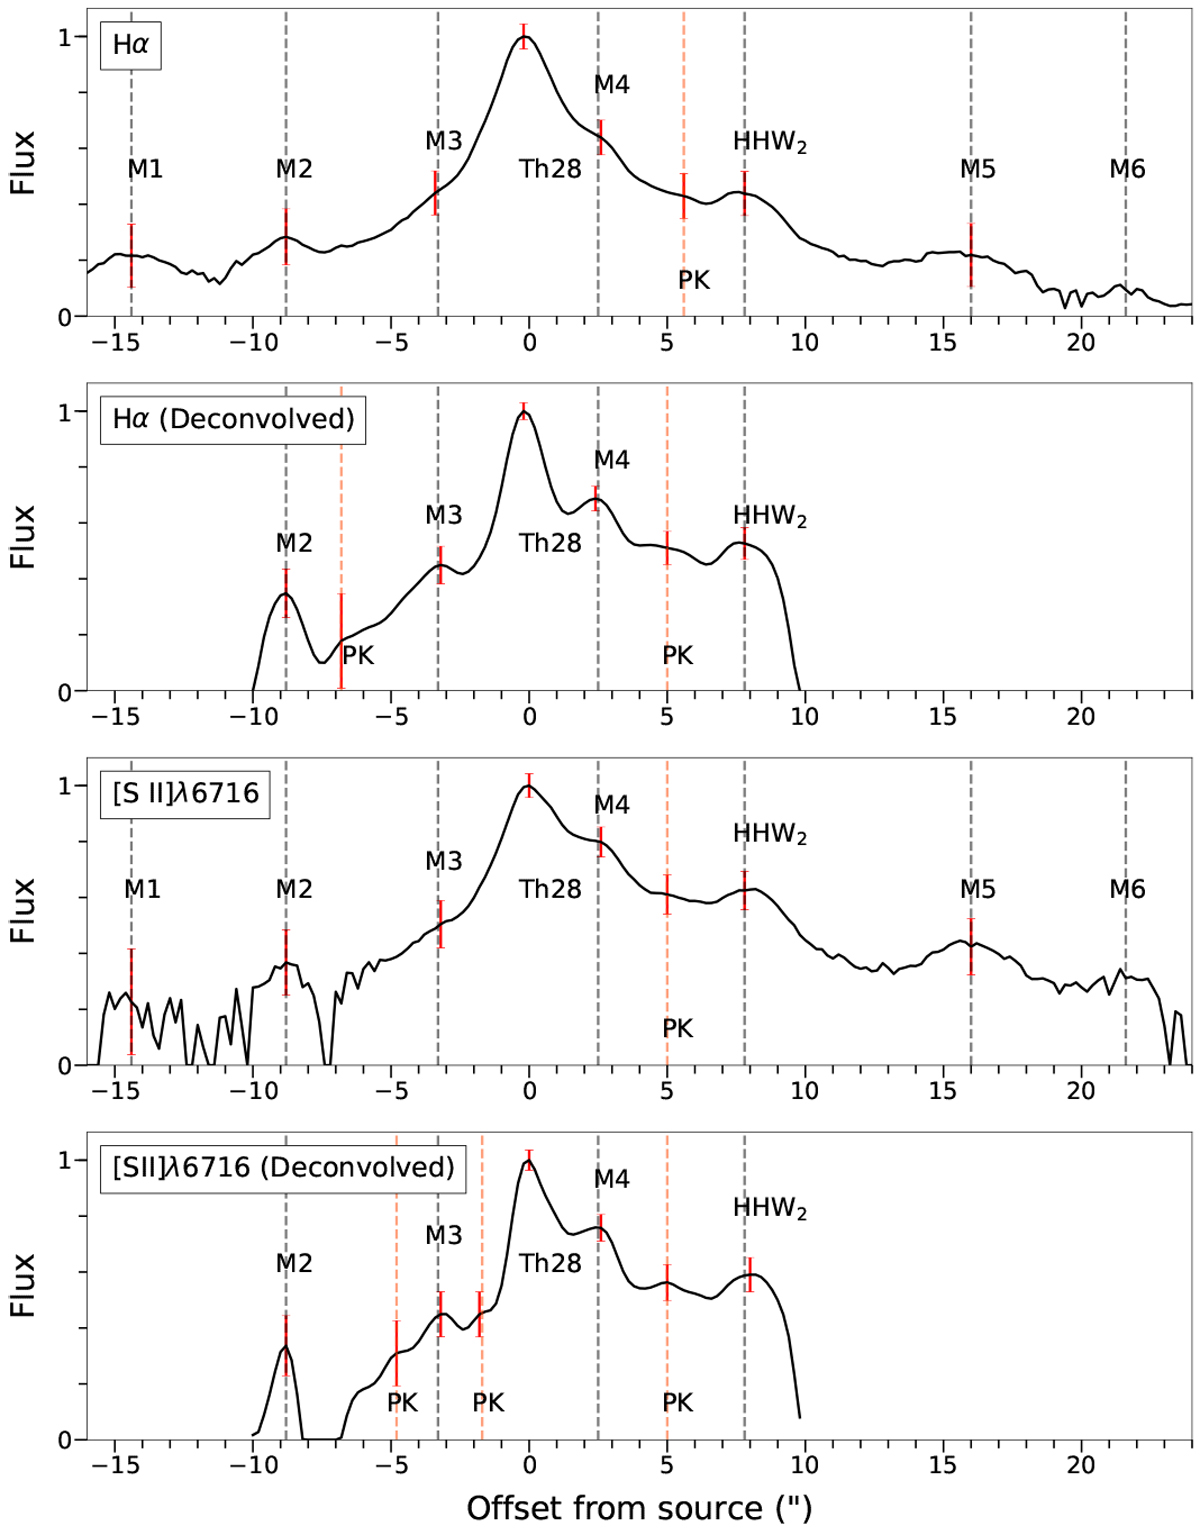
Hα and [S II]λ6716 flux along the axis of the jet, taken from a horizontal slice through the jet centre after rotating the velocity-binned image by −5.2°. Profiles are shown taken before and after deconvolution, with deconvolved profiles truncated at ± 10′′. The flux axis is plotted on a log scale to prevent the plot from being dominated by extremely high flux around the star and normalised to better compare the profiles in both lines. Possible knots are marked as PK.
Current usage metrics show cumulative count of Article Views (full-text article views including HTML views, PDF and ePub downloads, according to the available data) and Abstracts Views on Vision4Press platform.
Data correspond to usage on the plateform after 2015. The current usage metrics is available 48-96 hours after online publication and is updated daily on week days.
Initial download of the metrics may take a while.