Fig. 3
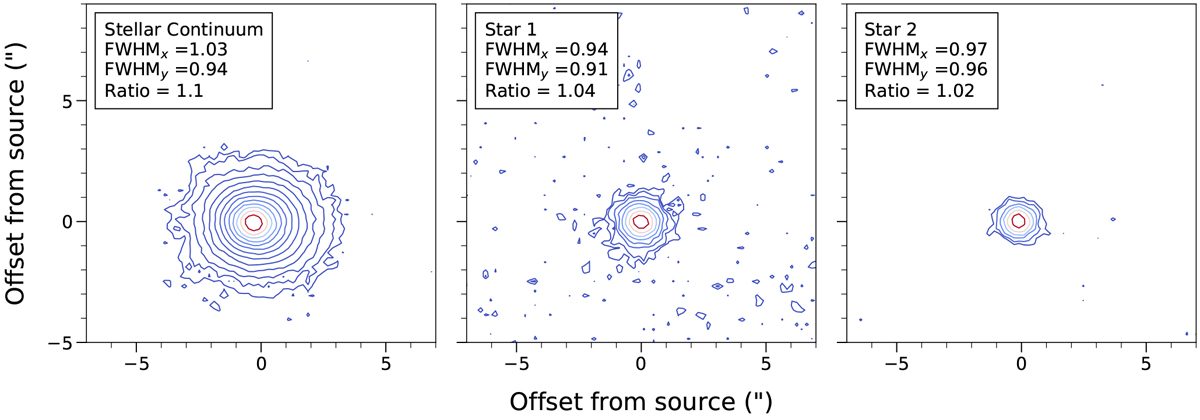
Spectro-images showing samples of the PSF estimated from continuum images of Th 28 (left) and two background stars (centre, right) in the Hα wavelength band, with contours starting at 4-σ of the background noise and increasing as factors of ![]() . Measured FWHM values are given in the y
and x
directions (perpendicular and parallel to the jet direction, respectively).
. Measured FWHM values are given in the y
and x
directions (perpendicular and parallel to the jet direction, respectively).
Current usage metrics show cumulative count of Article Views (full-text article views including HTML views, PDF and ePub downloads, according to the available data) and Abstracts Views on Vision4Press platform.
Data correspond to usage on the plateform after 2015. The current usage metrics is available 48-96 hours after online publication and is updated daily on week days.
Initial download of the metrics may take a while.