Fig. A.1
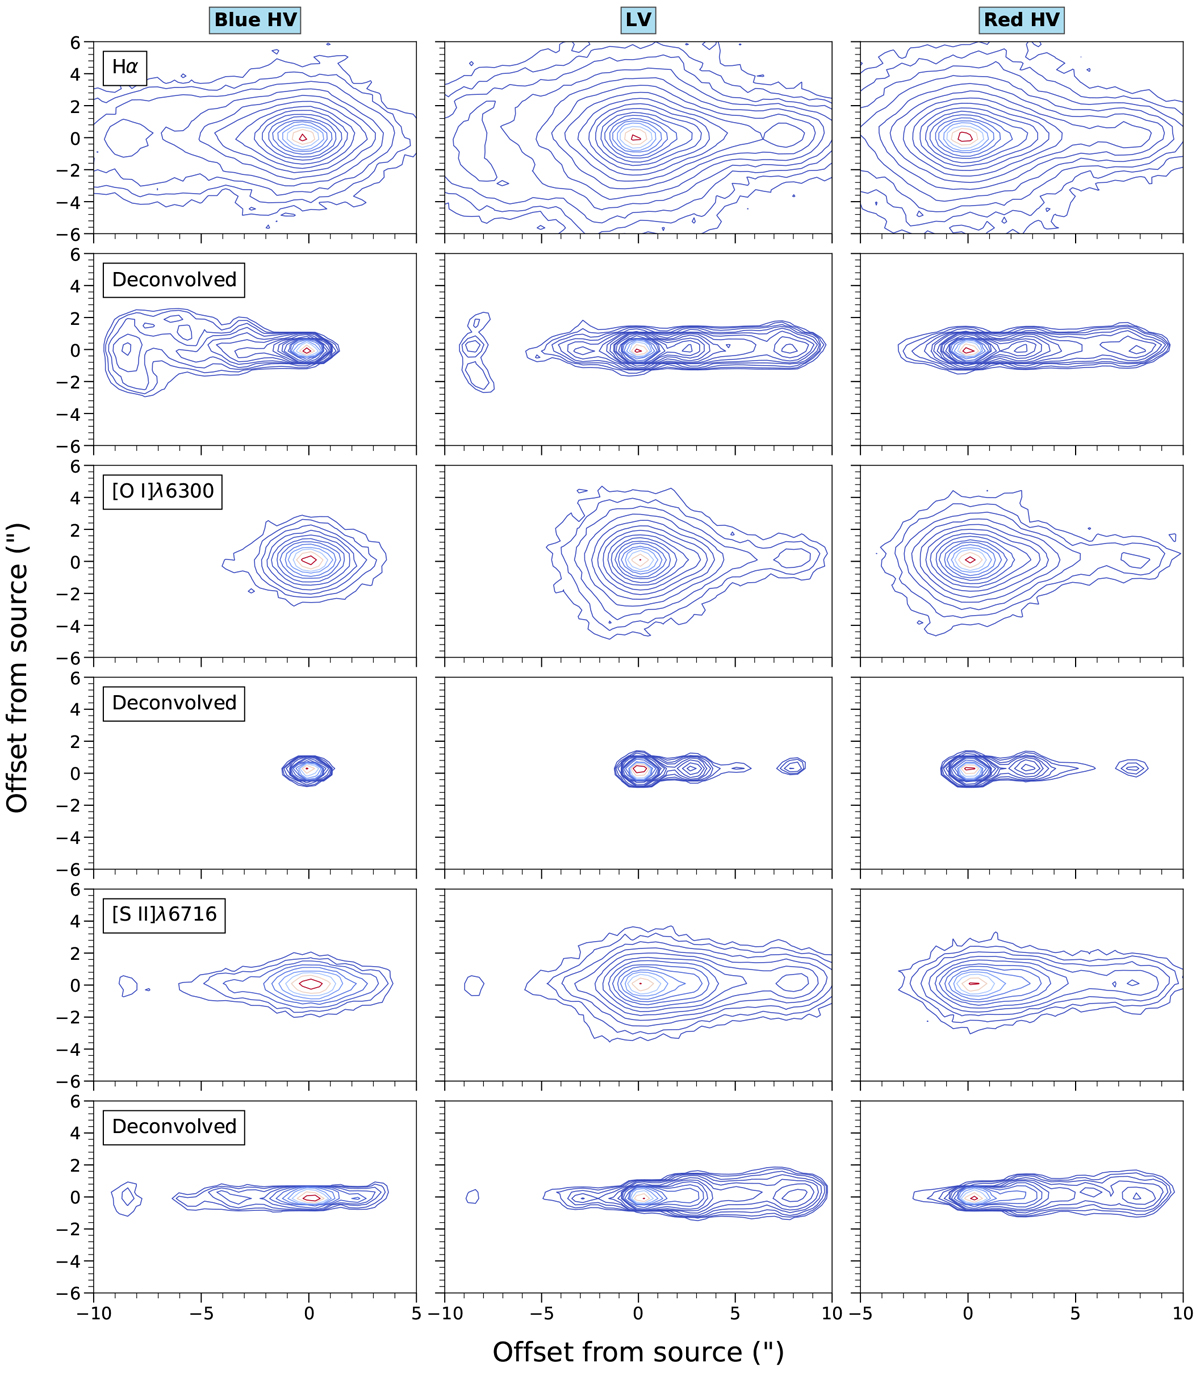
Spectroimages showing selected emission lines before and after Lucy-Richardson deconvolution (20 iterations), shown in three channels: the blue-shifted HVC (-150 to -90 km s−1); centre, the low-velocity channel (+/-90 km s−1); and the red-shifted HVC (+90 to -150 km s−1). The inner jet region in each emission line is shown first with the same region after deconvolution shown below it. Contours begin at 3-σ of thebackground noise in the unconvolved images, and increase as a factor of ![]() .
.
Current usage metrics show cumulative count of Article Views (full-text article views including HTML views, PDF and ePub downloads, according to the available data) and Abstracts Views on Vision4Press platform.
Data correspond to usage on the plateform after 2015. The current usage metrics is available 48-96 hours after online publication and is updated daily on week days.
Initial download of the metrics may take a while.