Free Access
Fig. 3
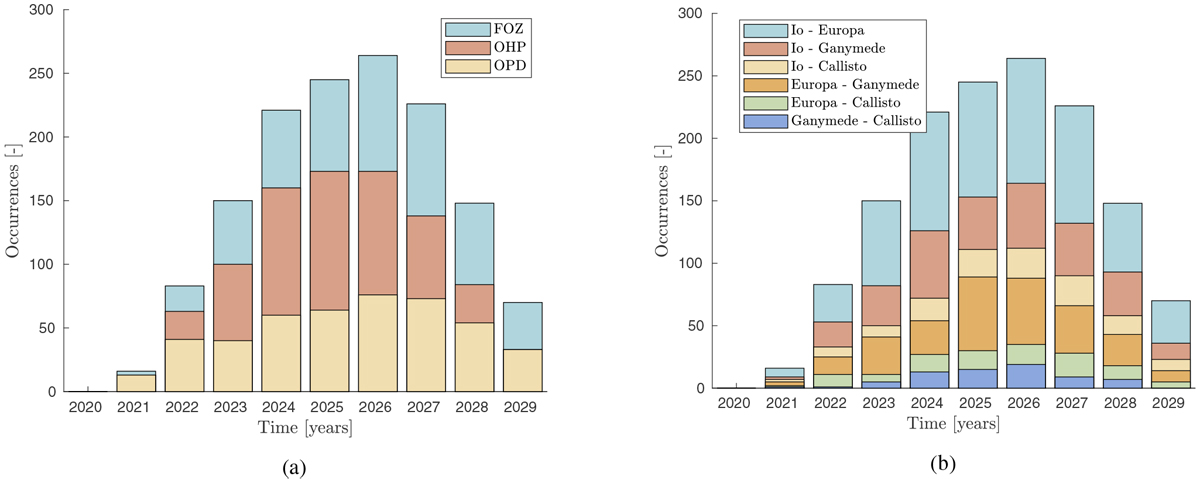
Distribution of the simulated mutual approximations per year, depending on the ground station (panel a) and on the two moons involved (panel b). Mutual approximations which have been discarded to mimic the effect of bad weather conditions are not included in this distribution.
Current usage metrics show cumulative count of Article Views (full-text article views including HTML views, PDF and ePub downloads, according to the available data) and Abstracts Views on Vision4Press platform.
Data correspond to usage on the plateform after 2015. The current usage metrics is available 48-96 hours after online publication and is updated daily on week days.
Initial download of the metrics may take a while.