Fig. 1.
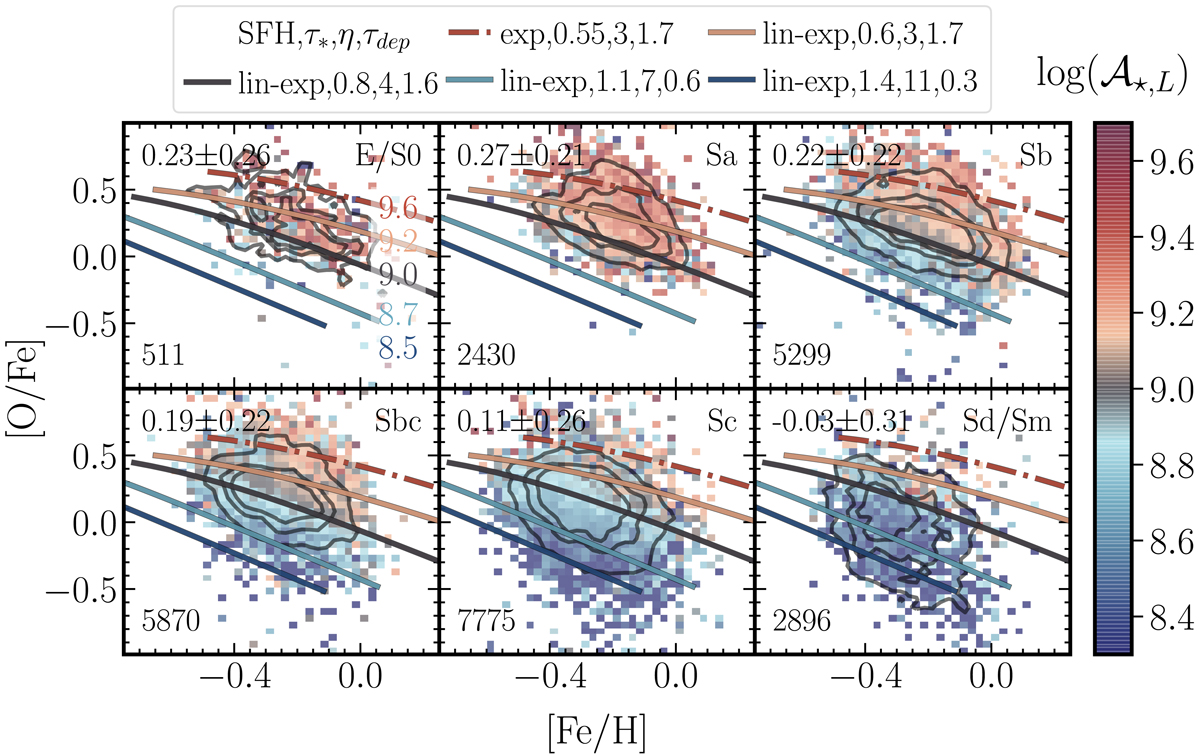
Distribution of [O/Fe] as a function of [Fe/H] for the H II regions of our sample (segregated by galaxy morphology), colour-coded by the average 𝒜⋆,L of the underlying stellar population. Contours represent the density of the plotted regions, encircling 95%, 80%, and 40% of them, respectively, with the total number shown at the bottom left of each panel. The average [O/Fe] value for each morphology is shown at the top left of each panel as well. The solid and dashed-dotted lines are all the same in the six panels. They correspond to the predictions by the five ChEMs described in the text, generated to cover the observed distributions. Each model is defined by the values of a set of input parameters (τ*, η, τdep) and two shapes of the SFHs (exponential decay, exp, and linear rising plus exponential decay, lin-exp), indicated in the upper legend. Lines are colour-coded according to the average 𝒜⋆,L as well. We note that there is no exact one-to-one correspondence between a single model and the observed distribution for a single morphological bin (i.e. panel).
Current usage metrics show cumulative count of Article Views (full-text article views including HTML views, PDF and ePub downloads, according to the available data) and Abstracts Views on Vision4Press platform.
Data correspond to usage on the plateform after 2015. The current usage metrics is available 48-96 hours after online publication and is updated daily on week days.
Initial download of the metrics may take a while.