Free Access
Fig. 9.
Download original image
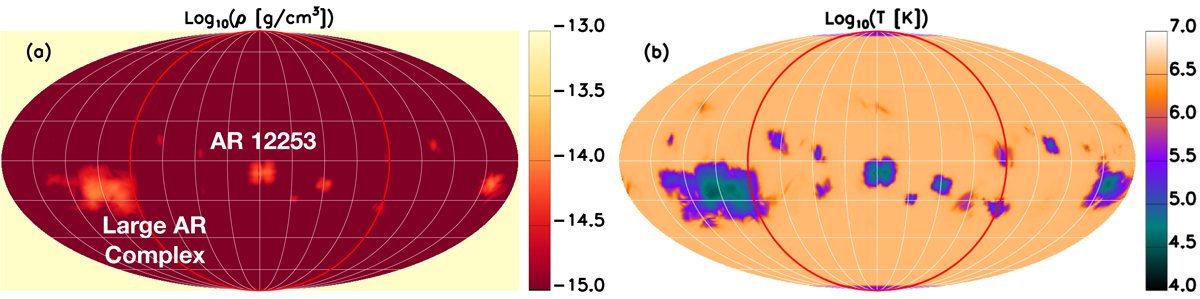
Plasma (panel a) and temperature (panel b) distributions of the initial condition of the MHD simulation. The region of the solar disk visible from SDO/Earth is indicated by the red circles while AR 12253 located near central meridian and the large AR complex behind the east limb are labelled in white.
Current usage metrics show cumulative count of Article Views (full-text article views including HTML views, PDF and ePub downloads, according to the available data) and Abstracts Views on Vision4Press platform.
Data correspond to usage on the plateform after 2015. The current usage metrics is available 48-96 hours after online publication and is updated daily on week days.
Initial download of the metrics may take a while.