Fig. 6.
Download original image
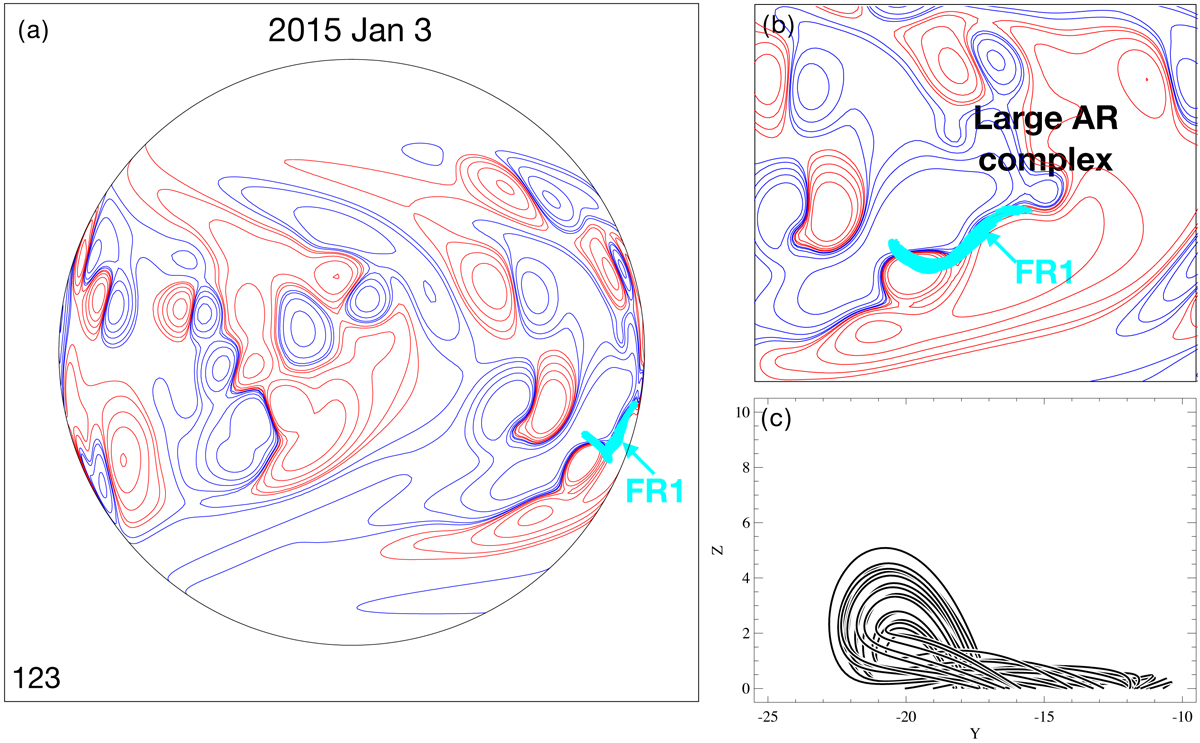
Magnetic field lines taken from the global NLFFF evolutionary model that show the presence of a flux rope (FR1) along the PIL of the large AR complex that is located behind the east solar limb. The panels are plotted using the same coordinate frame as Fig. 5 and the day of the simulation is given in the bottom left of panel a. The blue (red) contours represent negative (positive) photospheric magnetic field. Panel a: entire solar disk as it would be viewed from the farside of the Sun from the L3 perspective with a central meridian longitude of 180° and representative field lines of FR1 (light blue). Panels b and c: close up of the flux rope and the axis of the flux rope in the y − z plane, respectively.
Current usage metrics show cumulative count of Article Views (full-text article views including HTML views, PDF and ePub downloads, according to the available data) and Abstracts Views on Vision4Press platform.
Data correspond to usage on the plateform after 2015. The current usage metrics is available 48-96 hours after online publication and is updated daily on week days.
Initial download of the metrics may take a while.