Fig. 5.
Download original image
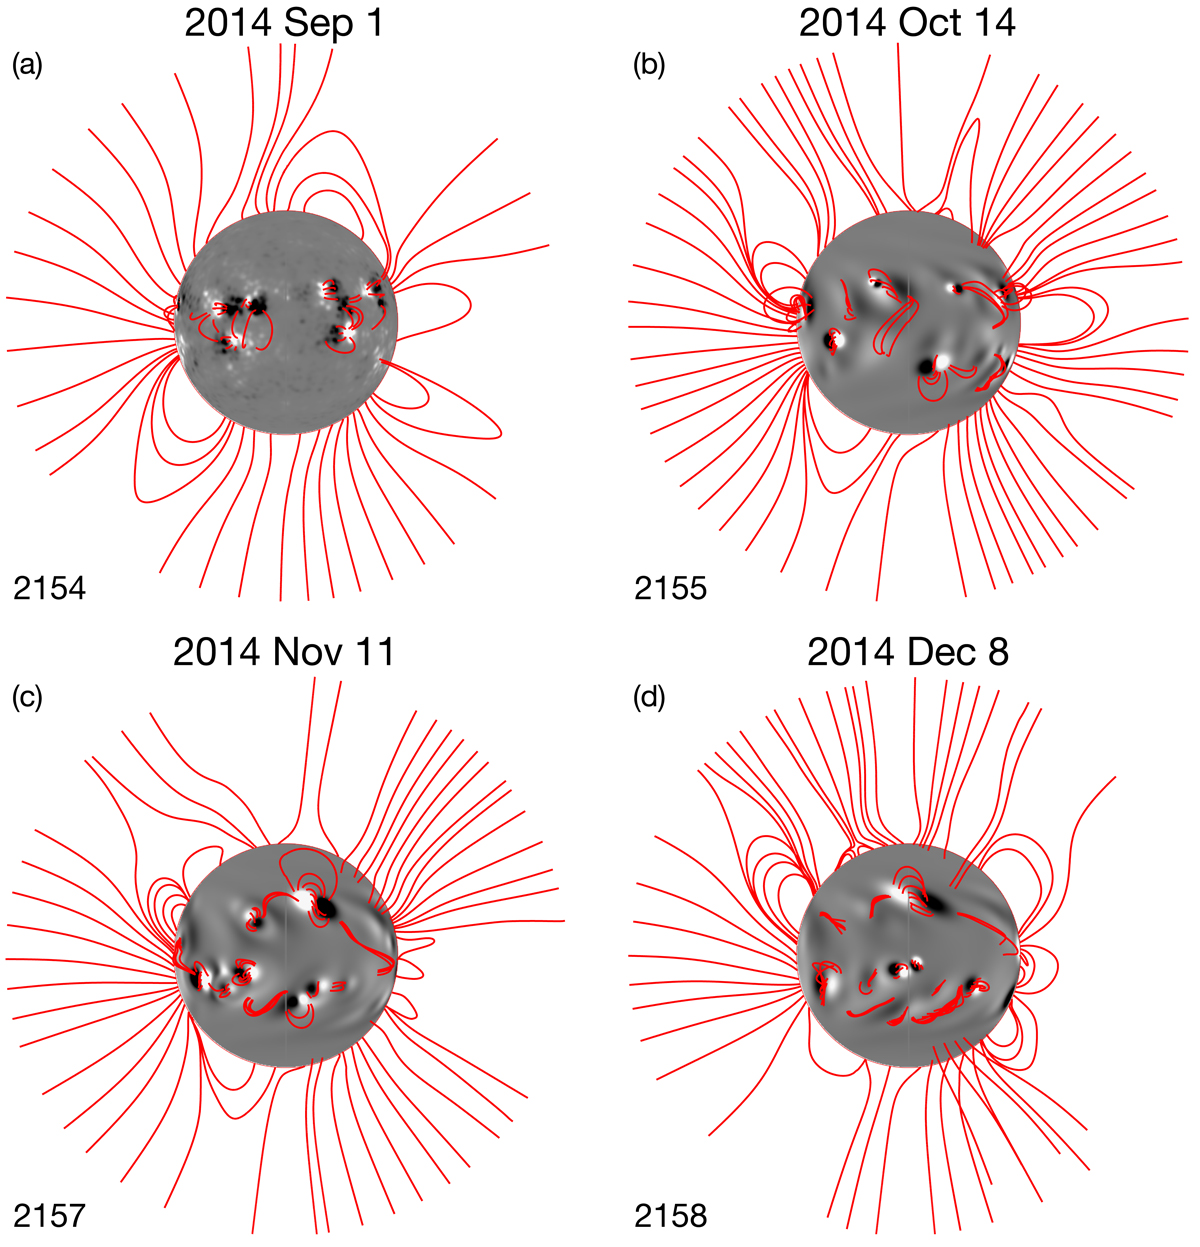
Magnetic field structure taken from the global NLFFF evolutionary model in the time period prior to the eruption of the stealth event that occurred on 2015 January 3. The panels show the radial magnetic field of the photosphere (grey) where white (black) regions correspond to positive (negative) magnetic field. The red lines are representative magnetic field lines from the model to show the configuration of the coronal magnetic field. The panels are plotted in a co-rotating frame at the Carrington rate where the corresponding Carrington Rotation is given in the bottom left. Panel a: the initial potential condition (day 1) of the model is shown where central meridian is at 215° longitude. For panels b–d central meridian is at 0° longitude.
Current usage metrics show cumulative count of Article Views (full-text article views including HTML views, PDF and ePub downloads, according to the available data) and Abstracts Views on Vision4Press platform.
Data correspond to usage on the plateform after 2015. The current usage metrics is available 48-96 hours after online publication and is updated daily on week days.
Initial download of the metrics may take a while.