Fig. 12.
Download original image
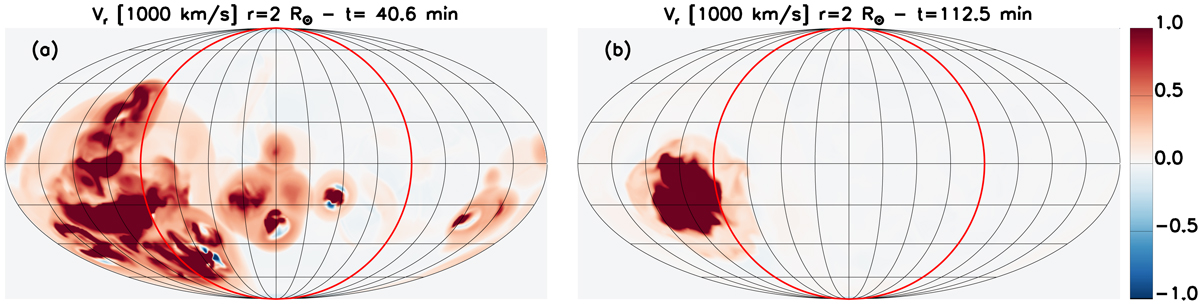
Radial velocity at r = 2 R⊙ for two different simulations where the photospheric density is varied. Panel a: radial velocity taken at t = 40.6 min for the simulation previously described where ρph = 2 × 10⁻¹⁶ g cm3. Panel b: radial velocity from a second simulation at the later time of t = 112.5 min, where the photospheric density has increased by an order magnitude ρph = 2 × 10⁻¹⁵ g cm3. The red circle represents the solar disk which is visible at Earth. Red (blue) corresponds to positive (negative) velocities which are saturated at ±1000 km s−1.
Current usage metrics show cumulative count of Article Views (full-text article views including HTML views, PDF and ePub downloads, according to the available data) and Abstracts Views on Vision4Press platform.
Data correspond to usage on the plateform after 2015. The current usage metrics is available 48-96 hours after online publication and is updated daily on week days.
Initial download of the metrics may take a while.