Fig. 11.
Download original image
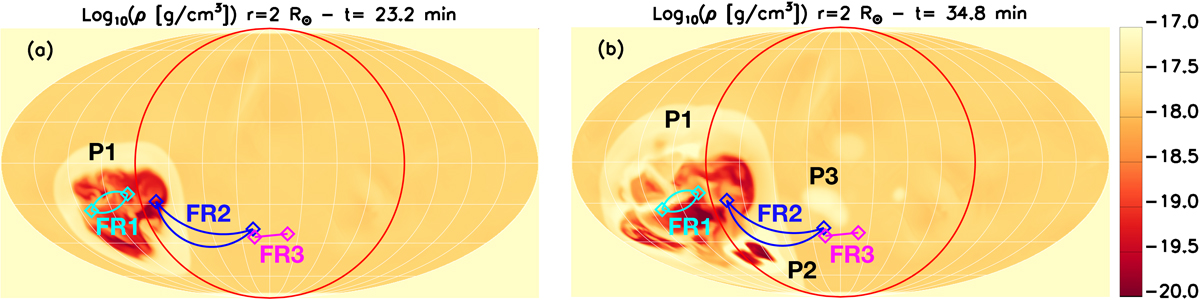
Density distribution taken at r = 2 R⊙ at t = 23.2 min and t = 34.8 min is shown in panels a and b, respectively. Here, the red circles illustrate the portion of the Mollweide map that corresponds to the ϕ coordinates on the solar disk visible from the Earth vantage point. The density perturbations that are a result of three flux rope eruptions occurring in the MHD simulation are labelled P1, P2 and P3. The light blue, dark blue, and magenta structures represent the approximate locations of the three flux ropes (F1, F2, F3) and their footpoints taken from the NLFFF evolutionary model.
Current usage metrics show cumulative count of Article Views (full-text article views including HTML views, PDF and ePub downloads, according to the available data) and Abstracts Views on Vision4Press platform.
Data correspond to usage on the plateform after 2015. The current usage metrics is available 48-96 hours after online publication and is updated daily on week days.
Initial download of the metrics may take a while.