Fig. 10.
Download original image
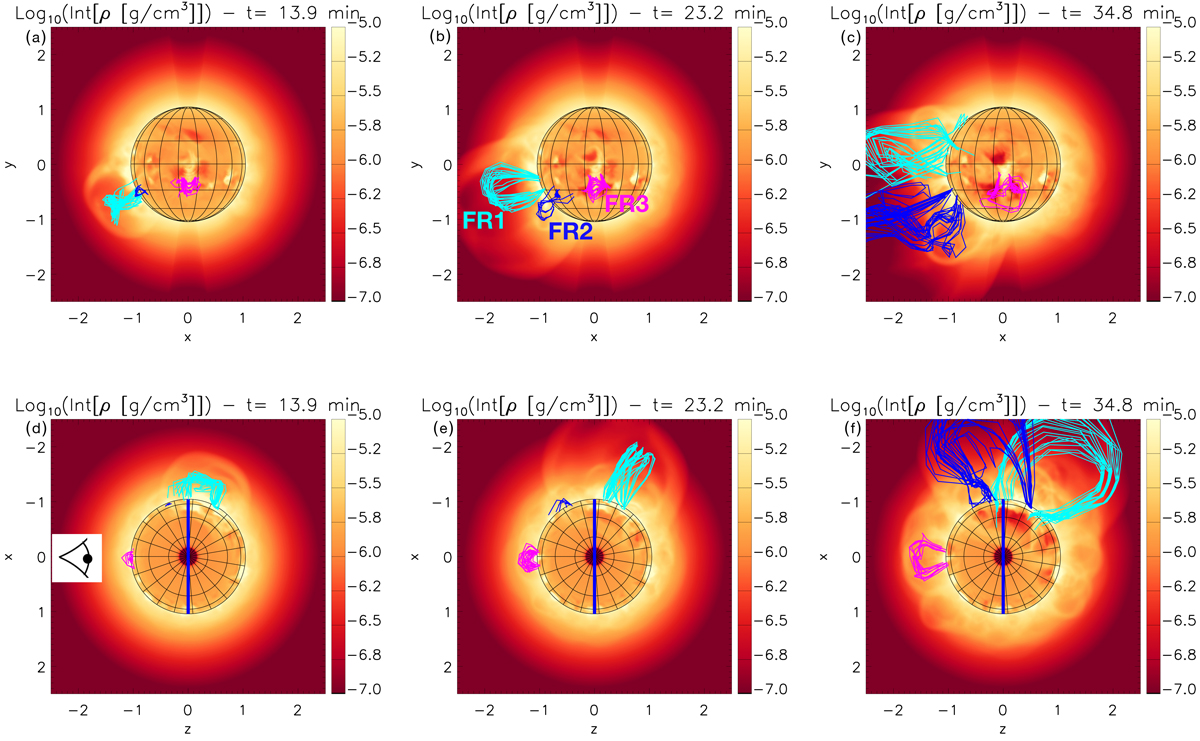
Coronal density distribution integrated along the line-of-sight taken from the MHD simulation. The density is shown at two different vantage points (as viewed from Earth in panels a–c and above the solar north pole in panels d–f) at the times of t = 13.9, 23.2, and 34.8 min. The blue line (bottom row) represents the plane-of-sky position. The eye symbol in the bottom row indicates the view as seen from SDO/at Earth. The panels also show the evolution of the magnetic field lines (light blue, dark blue, and magenta) of three flux ropes (FR1, FR2, and FR3) that erupt in the MHD simulation.
Current usage metrics show cumulative count of Article Views (full-text article views including HTML views, PDF and ePub downloads, according to the available data) and Abstracts Views on Vision4Press platform.
Data correspond to usage on the plateform after 2015. The current usage metrics is available 48-96 hours after online publication and is updated daily on week days.
Initial download of the metrics may take a while.