Fig. 1.
Download original image
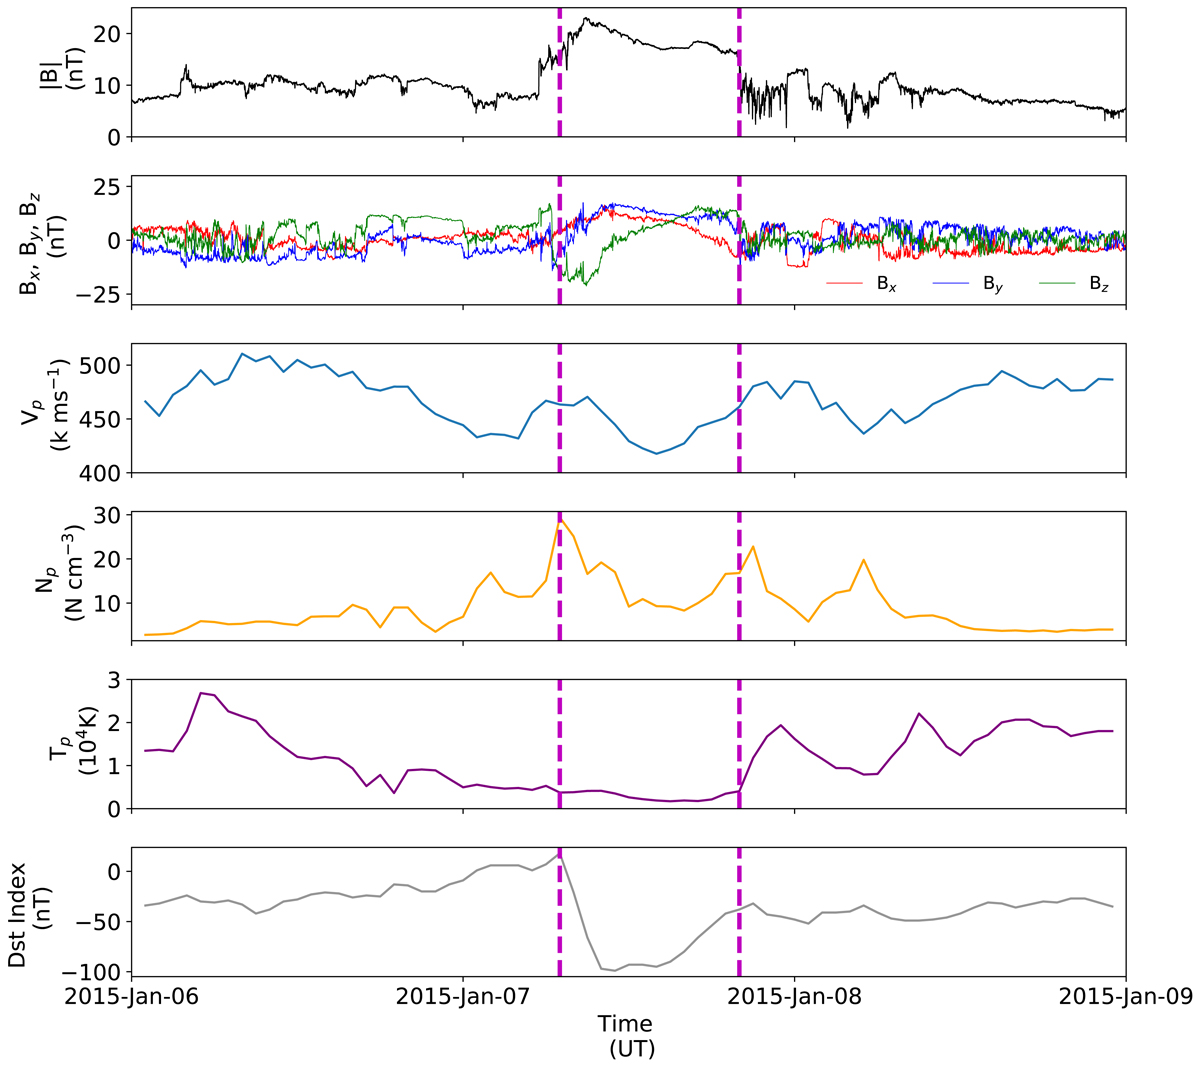
In-situ data taken between 2015 January 6−9, which shows the presence of an ICME on 2015 January 7. The panels from top to bottom show the magnitude of the magnetic field (ACE 16 s data), the magnetic field components (Bx, By, Bz) in Geocentric Solar Ecliptic (GSE) coordinates (ACE 16 s data), the solar wind speed (Vp; OMNI 1 h data), the solar wind density (Np; OMNI 1 h data), the proton temperature (Tp; OMNI 1 h data), and the Dst index (OMNI 1 h data). The purple dashed lines indicate the ICME interval from to 07:00 UT to 20:00 UT taken from the Richardson and Cane ICME catalog (http://www.srl.caltech.edu/ACE/ASC/DATA/level3/icmetable2.htm#(e)~).
Current usage metrics show cumulative count of Article Views (full-text article views including HTML views, PDF and ePub downloads, according to the available data) and Abstracts Views on Vision4Press platform.
Data correspond to usage on the plateform after 2015. The current usage metrics is available 48-96 hours after online publication and is updated daily on week days.
Initial download of the metrics may take a while.