Fig. 9
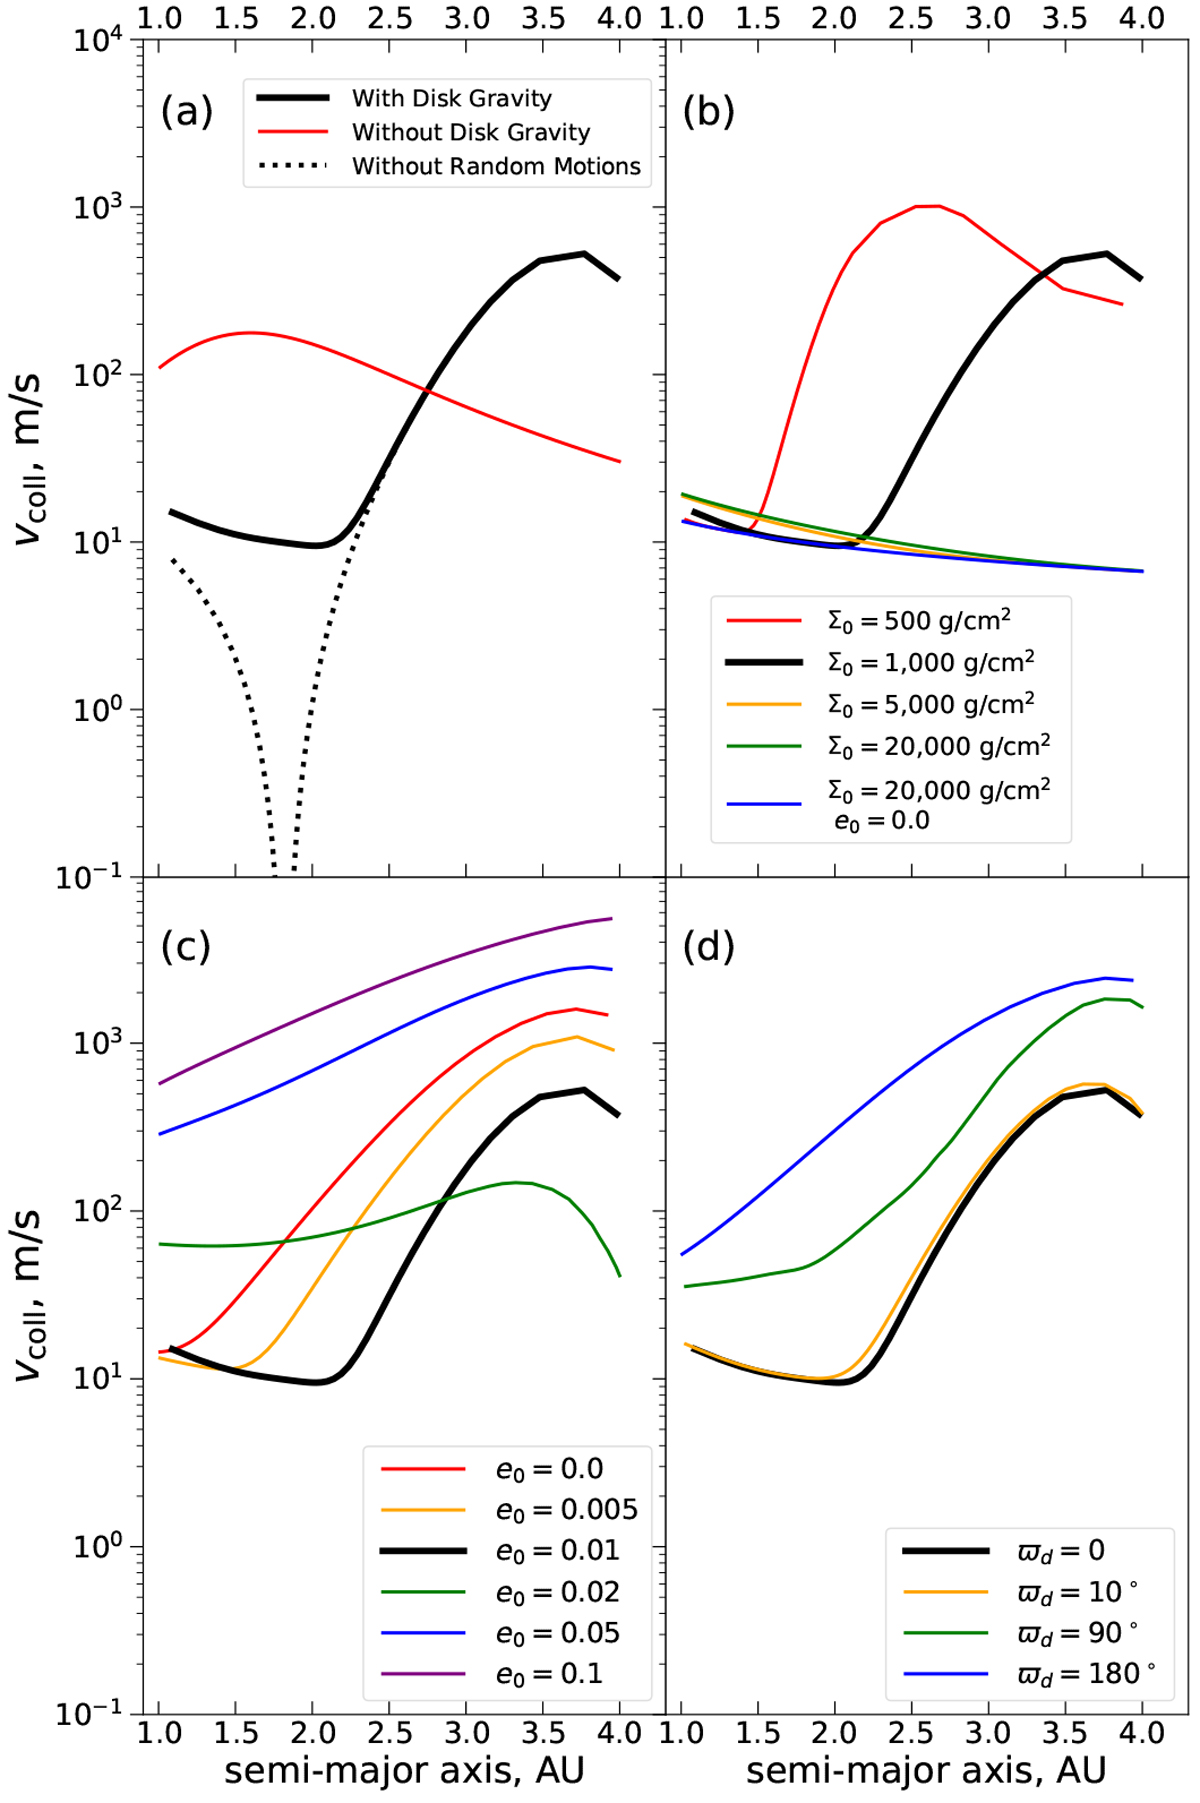
Collision velocity between d1 = 2 and d2 = 5 km planetesimals as a function of the semimajor axis a for the different values of model parameters varied one at a time (with respect to the fiducial set of parameters) and shown in the subplot legends. The fiducial value of the varied parameter in each subplot is shown with the solid black curve. The dotted line in panel (a) shows the collision velocities in the limit that σi = 0.
Current usage metrics show cumulative count of Article Views (full-text article views including HTML views, PDF and ePub downloads, according to the available data) and Abstracts Views on Vision4Press platform.
Data correspond to usage on the plateform after 2015. The current usage metrics is available 48-96 hours after online publication and is updated daily on week days.
Initial download of the metrics may take a while.