Fig. 7
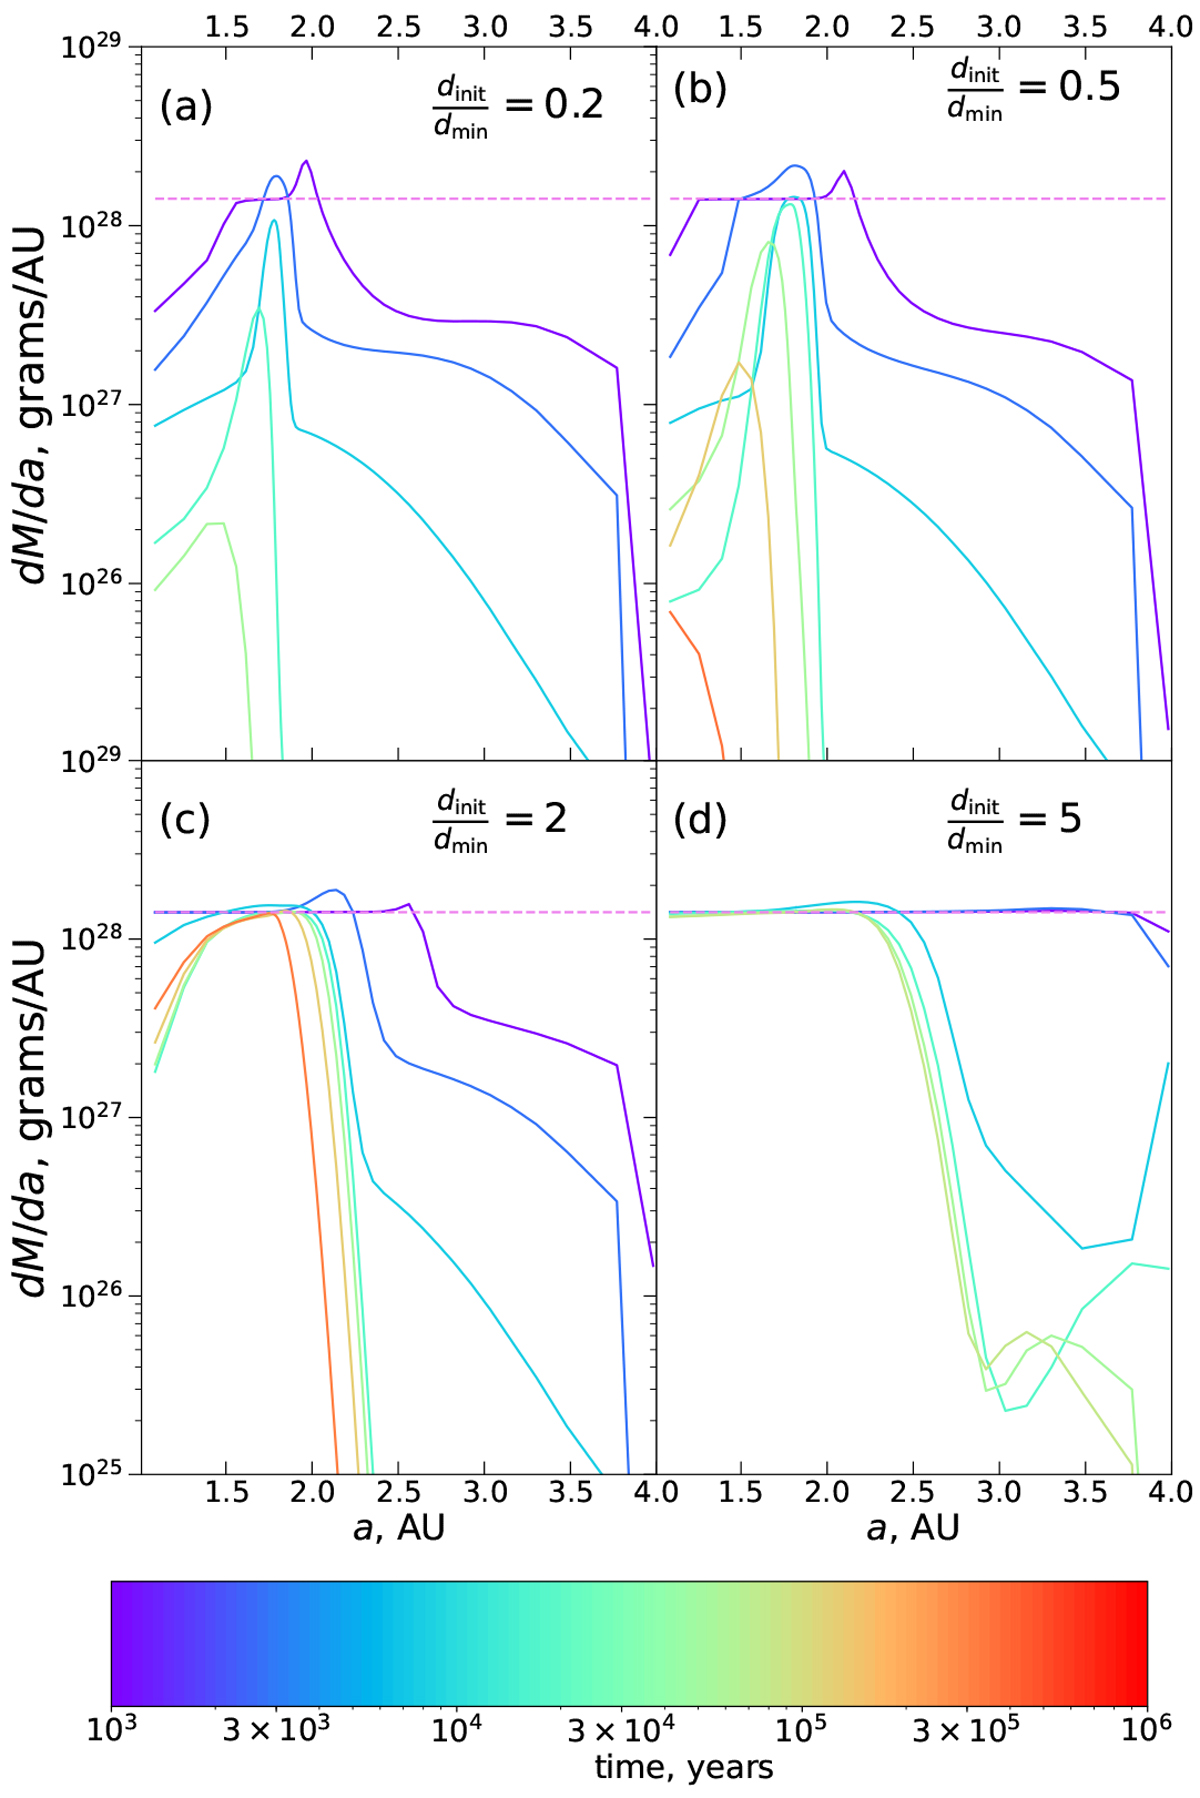
Mass in planetesimals of all sizes (tracked in our mass grid) in the disk per unit semimajor axis dM∕da = 2πaΣ(a) as a functionof a in our fiducial model at different moments of time (see color bar). The different panels correspond to the same initial planetesimalsizes dinit as in Fig. 6. The dashed violet horizontal line corresponds to the mass distribution at t = 0.
Current usage metrics show cumulative count of Article Views (full-text article views including HTML views, PDF and ePub downloads, according to the available data) and Abstracts Views on Vision4Press platform.
Data correspond to usage on the plateform after 2015. The current usage metrics is available 48-96 hours after online publication and is updated daily on week days.
Initial download of the metrics may take a while.