Fig. 4
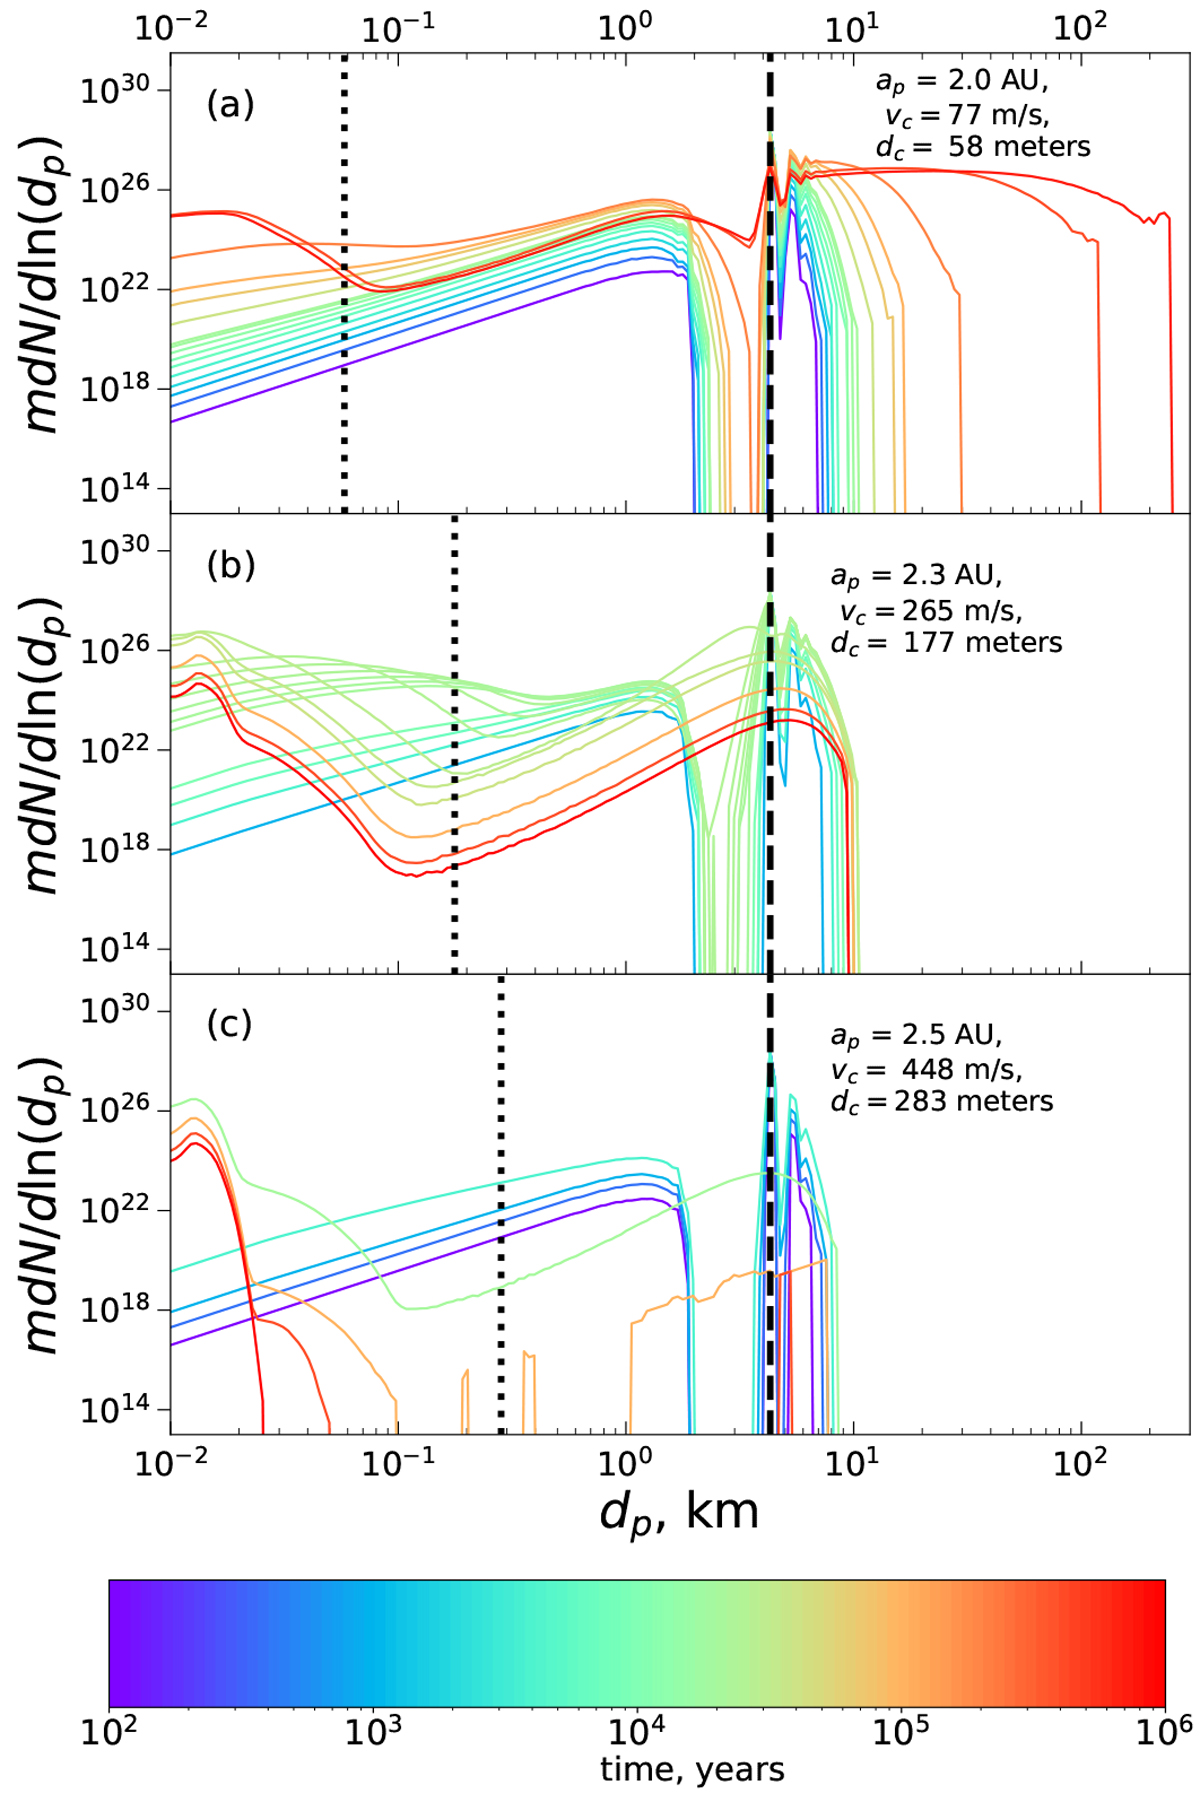
Evolution of the size distribution as a function of time in a set of single-annulus simulations, described in Sect. 5.1, which should be consulted for details. The three panels correspond to environments with the different values of the critical velocity vc and critical size dc, previously shown in Fig. 2, at different locations (as labeled) in the disk around the primary star in the γ Cephei system. The vertical dotted lines correspond to the critical size dc, and the vertical dashed lines correspond to the initial size of the planetesimals dinit.
Current usage metrics show cumulative count of Article Views (full-text article views including HTML views, PDF and ePub downloads, according to the available data) and Abstracts Views on Vision4Press platform.
Data correspond to usage on the plateform after 2015. The current usage metrics is available 48-96 hours after online publication and is updated daily on week days.
Initial download of the metrics may take a while.