Fig. 2
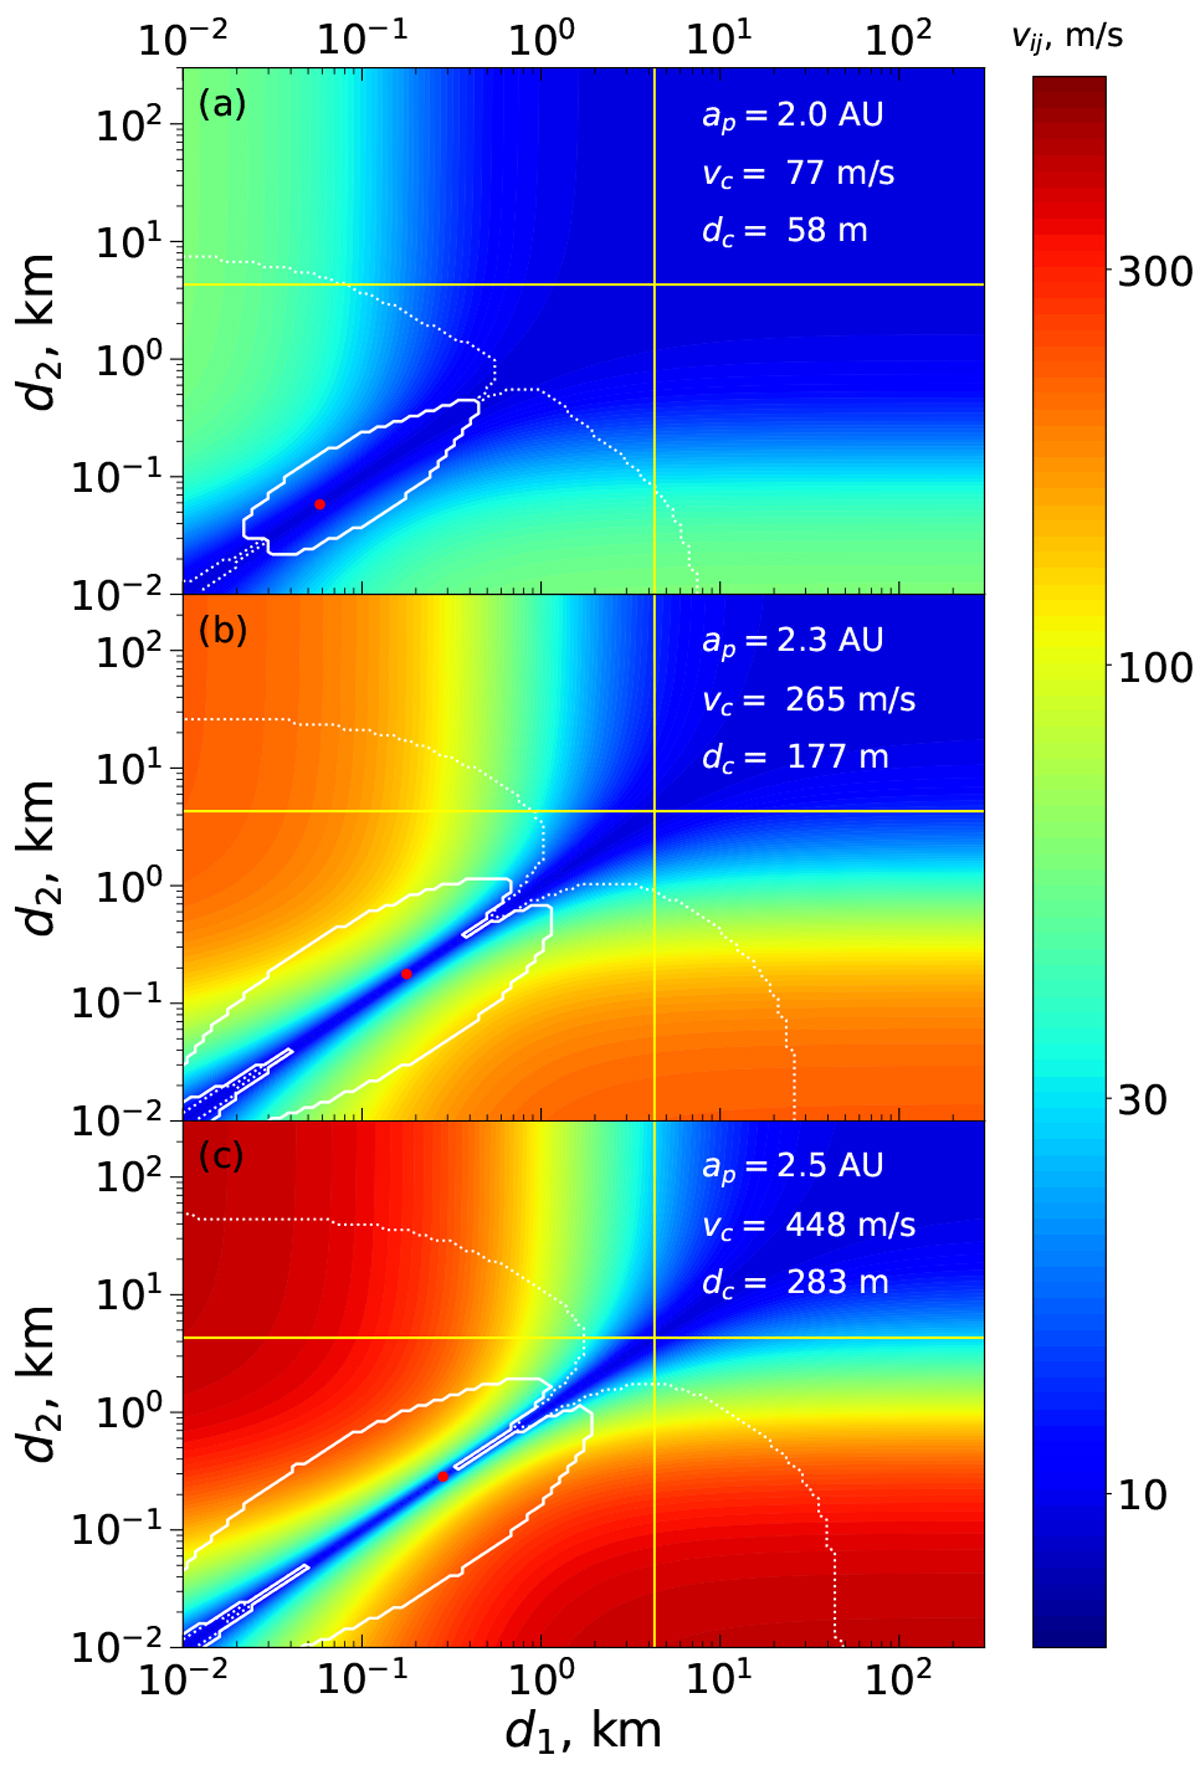
Collision velocities between two planetesimals as a function of their sizes d1 and d2 in a disk with the fiducial set of parameters given in Sect. 5 and σi = 10−4. Each panel corresponds to a different location in the disk, which leads to the varying values of vc and dc labeled on the panels. Regions of erosive collisions are outlined in dotted white lines, and regions of catastrophic disruption are enclosed by solid white lines. The horizontal and vertical yellow lines correspond to the initial planetesimal size dinit = 4.3 km used in the simulation described in Sect. 5.1. The point (dc, dc) is shown as a red dot.
Current usage metrics show cumulative count of Article Views (full-text article views including HTML views, PDF and ePub downloads, according to the available data) and Abstracts Views on Vision4Press platform.
Data correspond to usage on the plateform after 2015. The current usage metrics is available 48-96 hours after online publication and is updated daily on week days.
Initial download of the metrics may take a while.