Fig. B.3
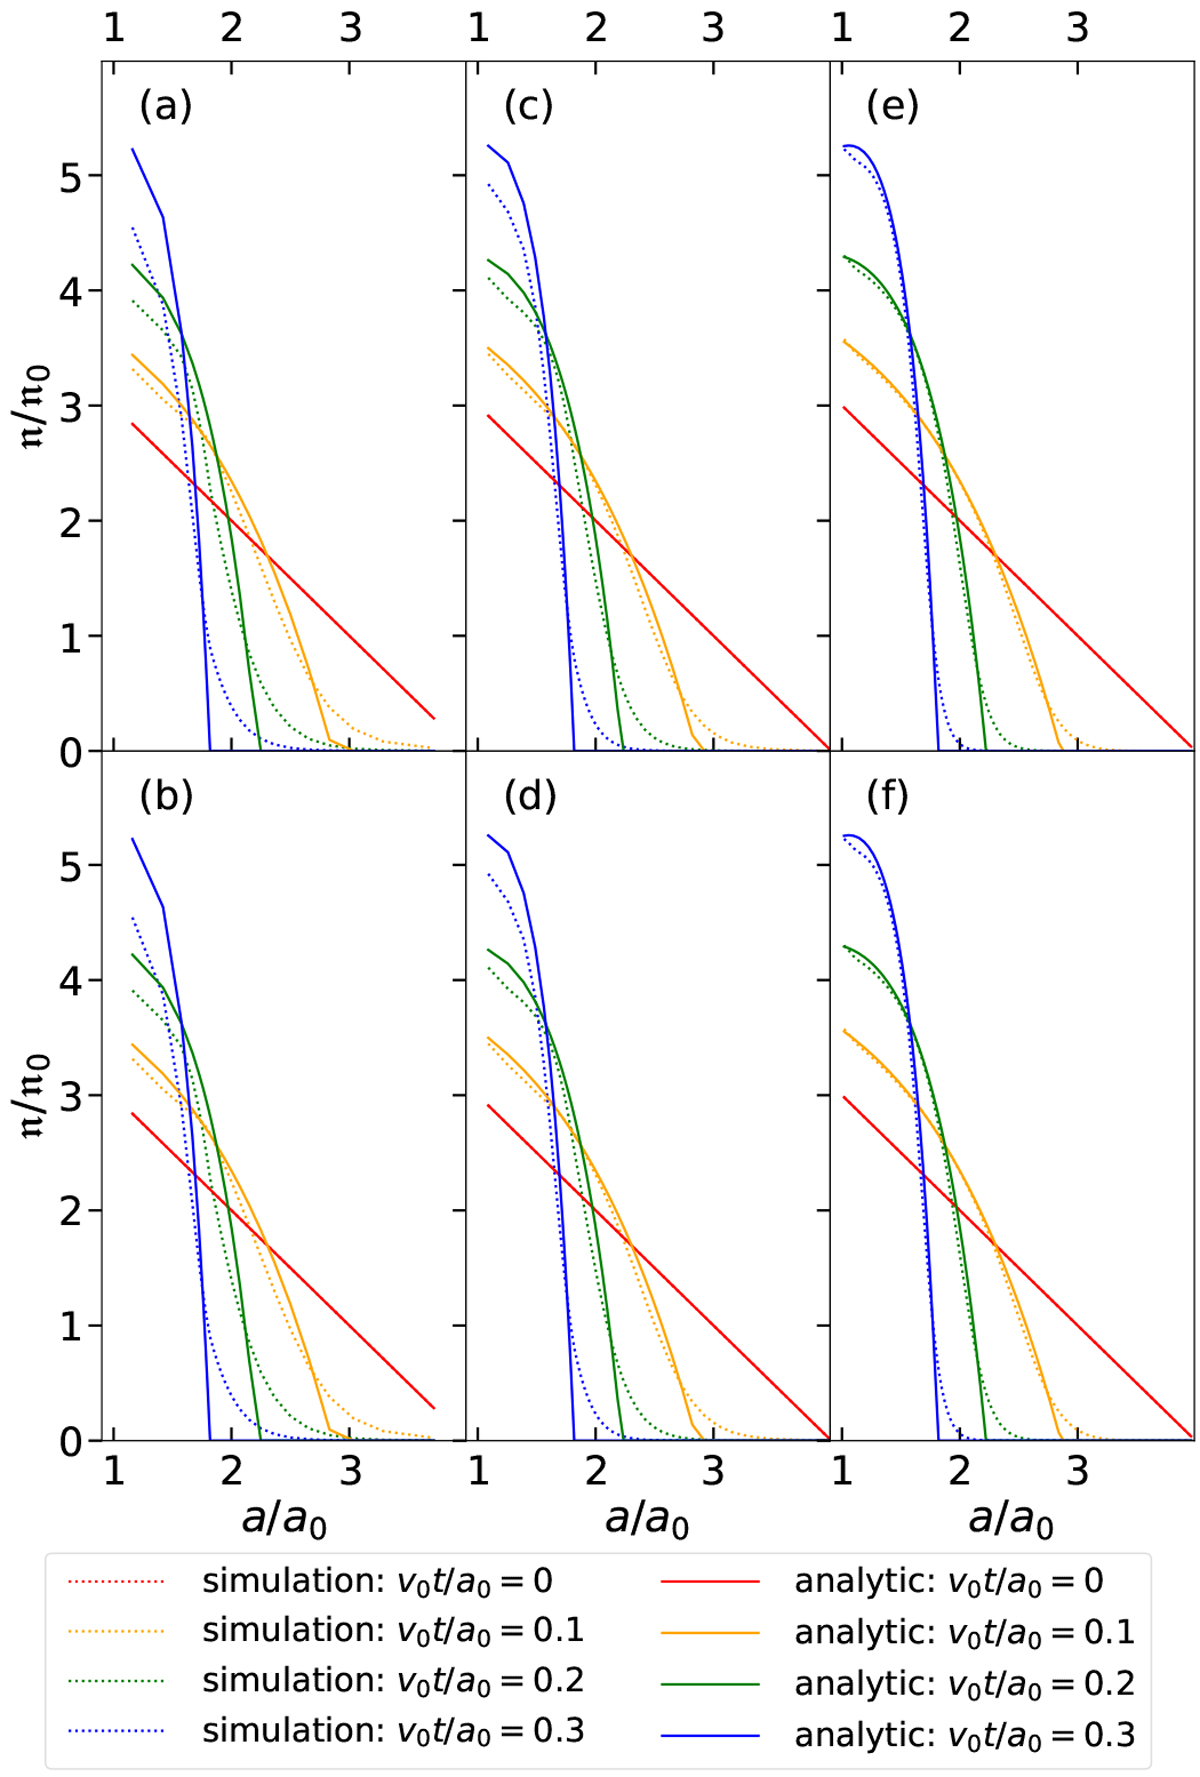
Test of the radial inspiral module: a comparison of the evolution of the surface density profile due to radial inspiral in the simulation (dotted lines) vs. the analytic result (solid lines) at different moments of time for the inspiral rate given by Eq. (B.7). Panels a, c, and e correspond to the cases with Nann = 30, 60, and 240 radial annuli between 1 and 4 AU, and ϵdrift = 1.0. The bottom panels, b, d, and f, have the same Nann values, but ϵdrift = 0.3.
Current usage metrics show cumulative count of Article Views (full-text article views including HTML views, PDF and ePub downloads, according to the available data) and Abstracts Views on Vision4Press platform.
Data correspond to usage on the plateform after 2015. The current usage metrics is available 48-96 hours after online publication and is updated daily on week days.
Initial download of the metrics may take a while.