Fig. B.2
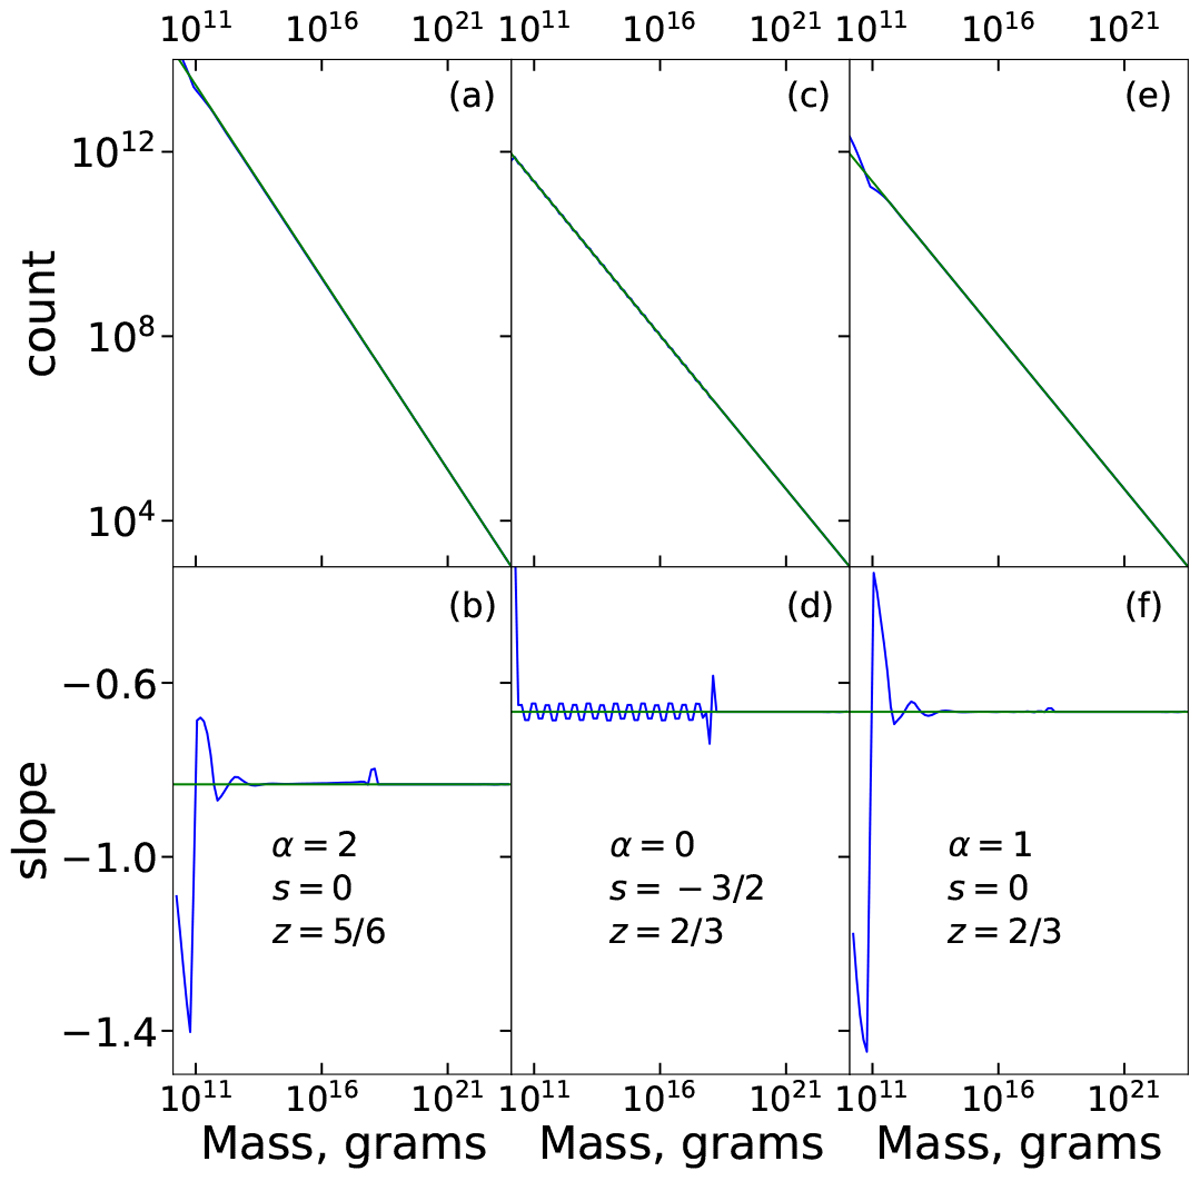
Test of our fragmentation module: comparison of our simulation results (blue) with the theoretical predictions of O’Brien & Greenberg (2003, green; they fall on top of the simulation outputs in the top panels). The upper panel shows the number of particles per mass bin as a function of mass. The bottom panel shows the power-law slope of this mass distribution. The rightmost 40% of the mass bins are held fixed, so as not to introduce errors due to the finite extent of our simulation in mass space and time. The values of α, s, and z are labeled on the panels. See Sect. B.2 for details.
Current usage metrics show cumulative count of Article Views (full-text article views including HTML views, PDF and ePub downloads, according to the available data) and Abstracts Views on Vision4Press platform.
Data correspond to usage on the plateform after 2015. The current usage metrics is available 48-96 hours after online publication and is updated daily on week days.
Initial download of the metrics may take a while.