Fig. 6.
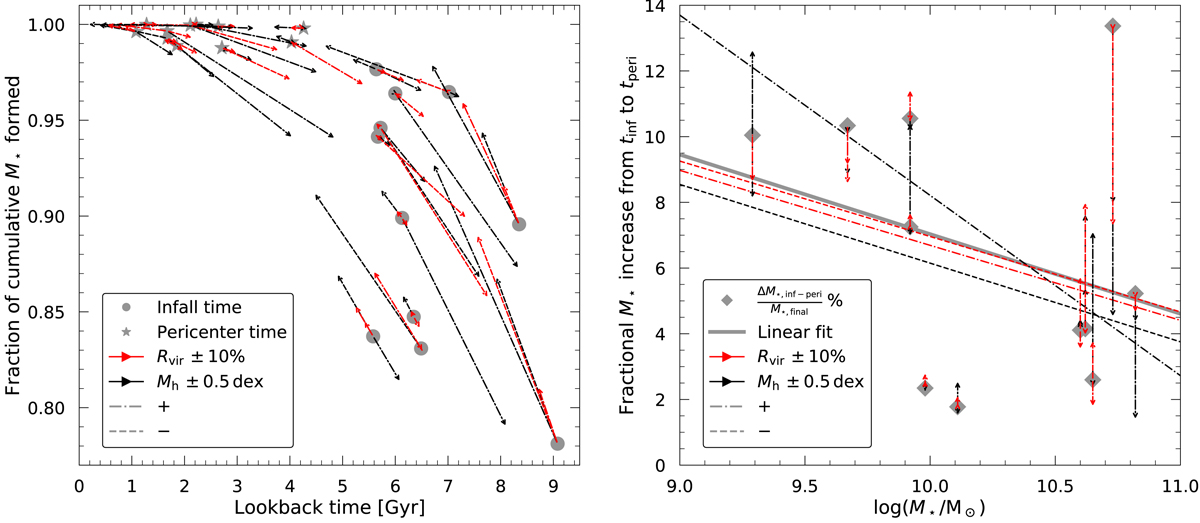
Estimation of systematic errors. Left panel: change in fractional stellar mass formed at infall and pericenter times incurred by introducing a systematic 0.5 dex offset in the satellite halo mass (black arrows) or a 10% change to the Coma virial radius, propagated to all quantities that depend on this measurement (red arrows). Dash-dotted (dashed) arrows indicate the result of a positive (negative) shift in the relevant quantity. These shifts are typically small and hence do not affect the overall qualitative interpretation of our work. We note that the axes of the figure are zoomed-in relative to Fig. 4 to show the very small shifts. See Sect. 4.3 for further details. Right panel: change in fractional stellar mass formed between infall and pericenter due to the introduction of the same systematic offsets as in the left panel.
Current usage metrics show cumulative count of Article Views (full-text article views including HTML views, PDF and ePub downloads, according to the available data) and Abstracts Views on Vision4Press platform.
Data correspond to usage on the plateform after 2015. The current usage metrics is available 48-96 hours after online publication and is updated daily on week days.
Initial download of the metrics may take a while.