Fig. 5.
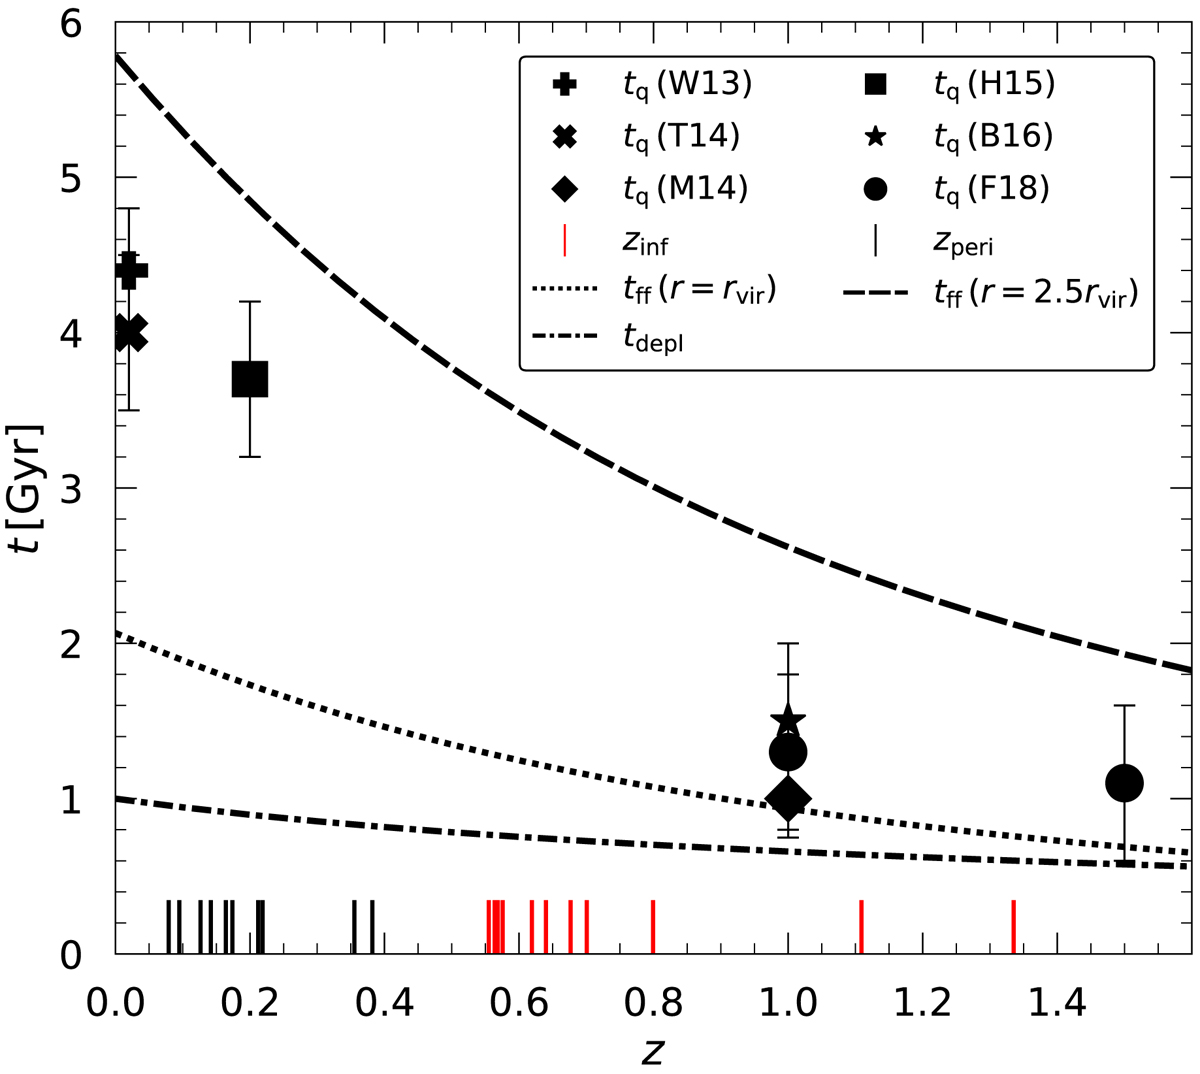
Redshift dependence of the quenching timescale tq. The solid black points show the quenching timescales in clusters at different redshifts as measured by Wetzel et al. (2013, W13), Taranu et al. (2014, T14), Muzzin et al. (2014, M14), Haines et al. (2015, H15), Balogh et al. (2016, B16), Foltz et al. (2018, F18). The dashed and dotted lines show the free fall timescales tff from r = 2.5rvir and r = rvir, respectively, for the Coma cluster. The dash-dotted line shows the molecular gas depletion timescale (tdepl) with redshift (Tacconi et al. 2018), normalized to ∼1 Gyr at z = 0. The red and black ticks show the expected infall and pericenter redshifts, respectively, for the galaxies in this study.
Current usage metrics show cumulative count of Article Views (full-text article views including HTML views, PDF and ePub downloads, according to the available data) and Abstracts Views on Vision4Press platform.
Data correspond to usage on the plateform after 2015. The current usage metrics is available 48-96 hours after online publication and is updated daily on week days.
Initial download of the metrics may take a while.