Fig. 4.
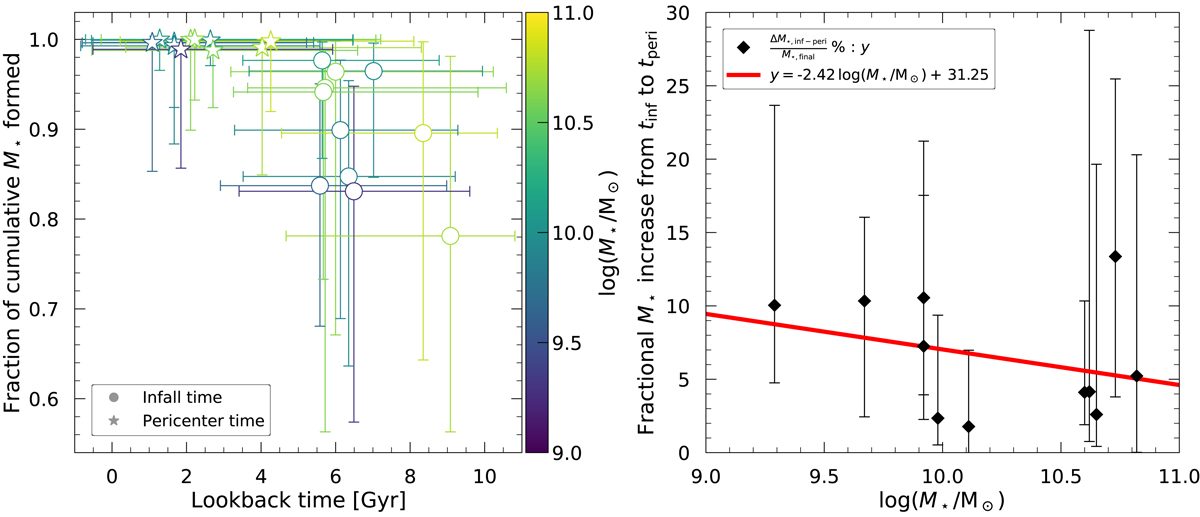
The stellar mass formed in the Coma cluster environment as a function of orbital phase. Left panel: fraction of cumulative stellar mass for all the galaxies in this study at their expected infall (circles) and pericenter (stars) times. The galaxies are color-coded based on their present-day stellar masses. The error bars represent 68% confidence intervals on the expectation values. Higher stellar mass galaxies have formed a higher percentage of stellar mass at infall in comparison to the lower stellar mass galaxies. All galaxies have likely formed more than 95% of their stellar mass by the time of their first pericentric passage in Coma. Right panel: fractional increases in stellar mass between infall and pericenter time (black filled diamonds with 68% confidence intervals) are shown for all galaxies. The medians and confidence intervals are determined from the distribution of time differences and corresponding assembled mass differences computed for each individual matching N-body orbit (i.e., we do not plot the difference between the marginalized distributions shown in the left panel). The linear regression through the data (magenta line) hints that lower stellar mass galaxies may have formed relatively more stellar mass as compared to their higher stellar mass counterparts.
Current usage metrics show cumulative count of Article Views (full-text article views including HTML views, PDF and ePub downloads, according to the available data) and Abstracts Views on Vision4Press platform.
Data correspond to usage on the plateform after 2015. The current usage metrics is available 48-96 hours after online publication and is updated daily on week days.
Initial download of the metrics may take a while.