Fig. 3.
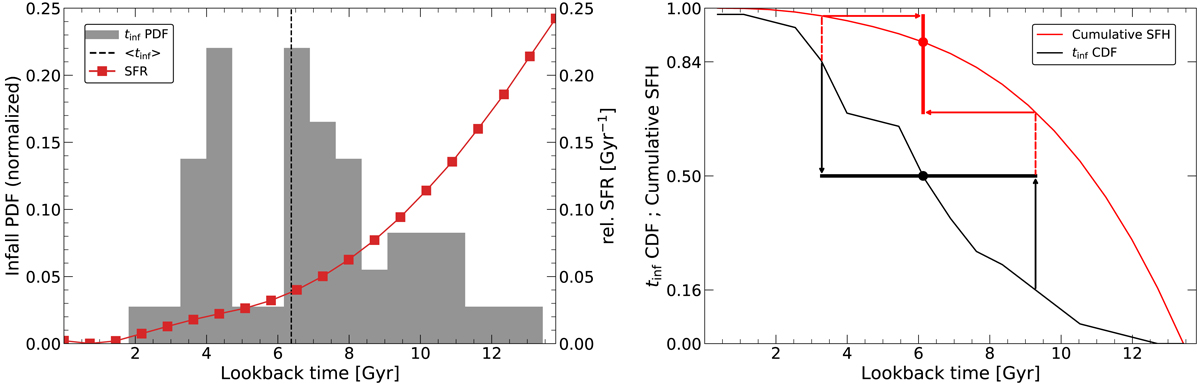
Connecting orbital history with SFH. Left panel: probability distribution of infall time of GMP 3254 is shown in the gray histogram (left axis labels) and its SFH (right axis labels) is shown as the red points. The median value of its infall time probability distribution is shown as a dotted black vertical line. The SFR has dropped significantly by ⟨tinf⟩. Right panel: cumulative SFH – the fractional stellar mass accumulation over time – is shown (red line) along with the cumulative probability distribution of the infall time (black line) for GMP 3254. The median infall time (black filled circle) is marked with its 68% confidence interval (horizontal black line) at the 50th and 16th–84th percentiles, respectively. The corresponding accumulated stellar mass at the median infall time (red filled circle) and the its associated 68% confidence interval (vertical red line) are also shown. The arrows (black and red) indicate the translation of 16th and 84th percentile points on the cumulative distribution curve to boundary of the confidence interval lines. GMP 3254 (log10M⋆/M⊙ = 9.92) has formed around 90% of its stellar mass at the median infall time. Figure 4 (left panel) shows the accumulated stellar mass at the (median) infall and pericenter times for all galaxies in this study.
Current usage metrics show cumulative count of Article Views (full-text article views including HTML views, PDF and ePub downloads, according to the available data) and Abstracts Views on Vision4Press platform.
Data correspond to usage on the plateform after 2015. The current usage metrics is available 48-96 hours after online publication and is updated daily on week days.
Initial download of the metrics may take a while.