Fig. 1.
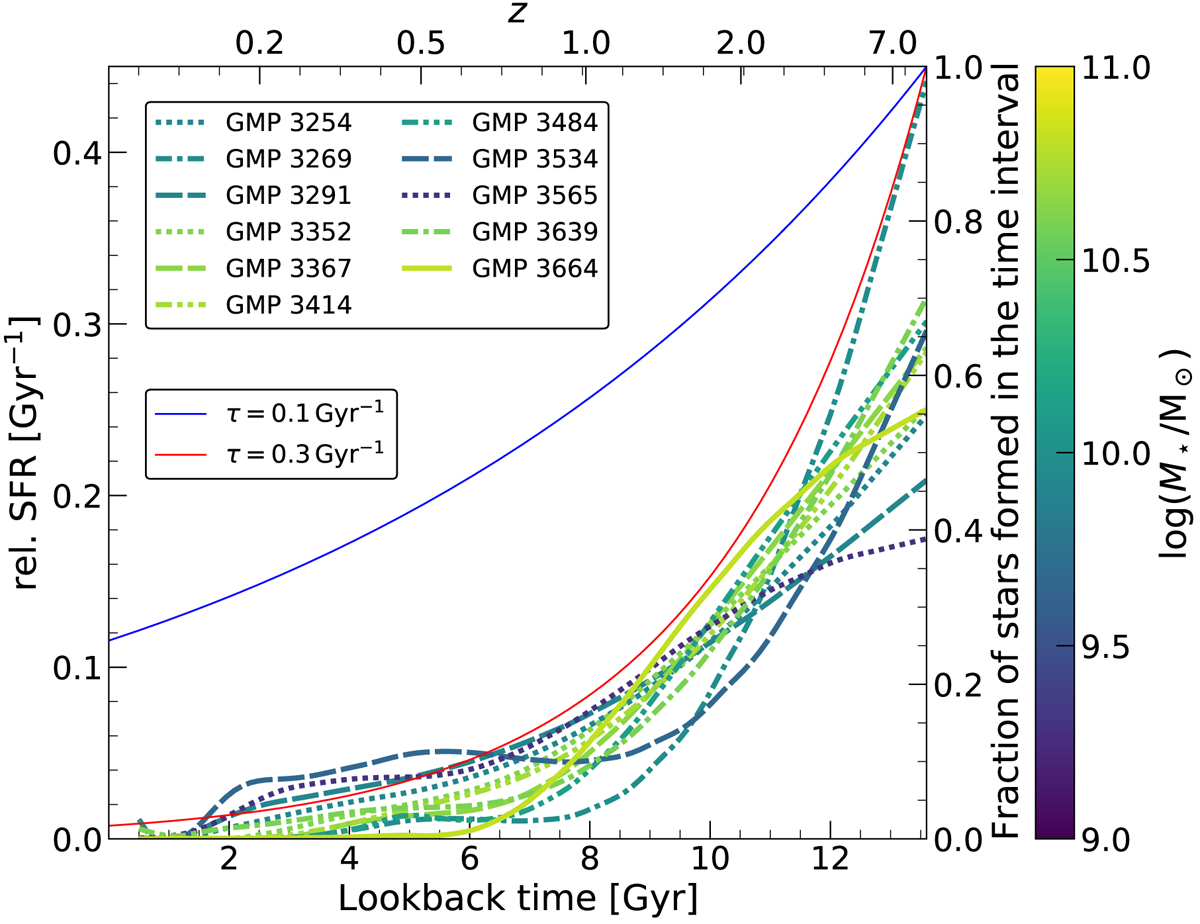
Star formation histories of galaxies in our sample determined using STECKMAP, using the MILES SSP model. The SFRs returned by STECKMAP are relative, not absolute, so we show them in units of Gyr−1. The curves are color-coded based on the satellite stellar masses. STECKMAP does not cover lookback times < 0.5 Gyr. The red and blue lines show the exponentially decaying form (SFR ∝ exp(τt)) of SFHs of red (early-type) and blue (late-type) galaxies respectively (Tojeiro et al. 2013).
Current usage metrics show cumulative count of Article Views (full-text article views including HTML views, PDF and ePub downloads, according to the available data) and Abstracts Views on Vision4Press platform.
Data correspond to usage on the plateform after 2015. The current usage metrics is available 48-96 hours after online publication and is updated daily on week days.
Initial download of the metrics may take a while.