Fig. 8
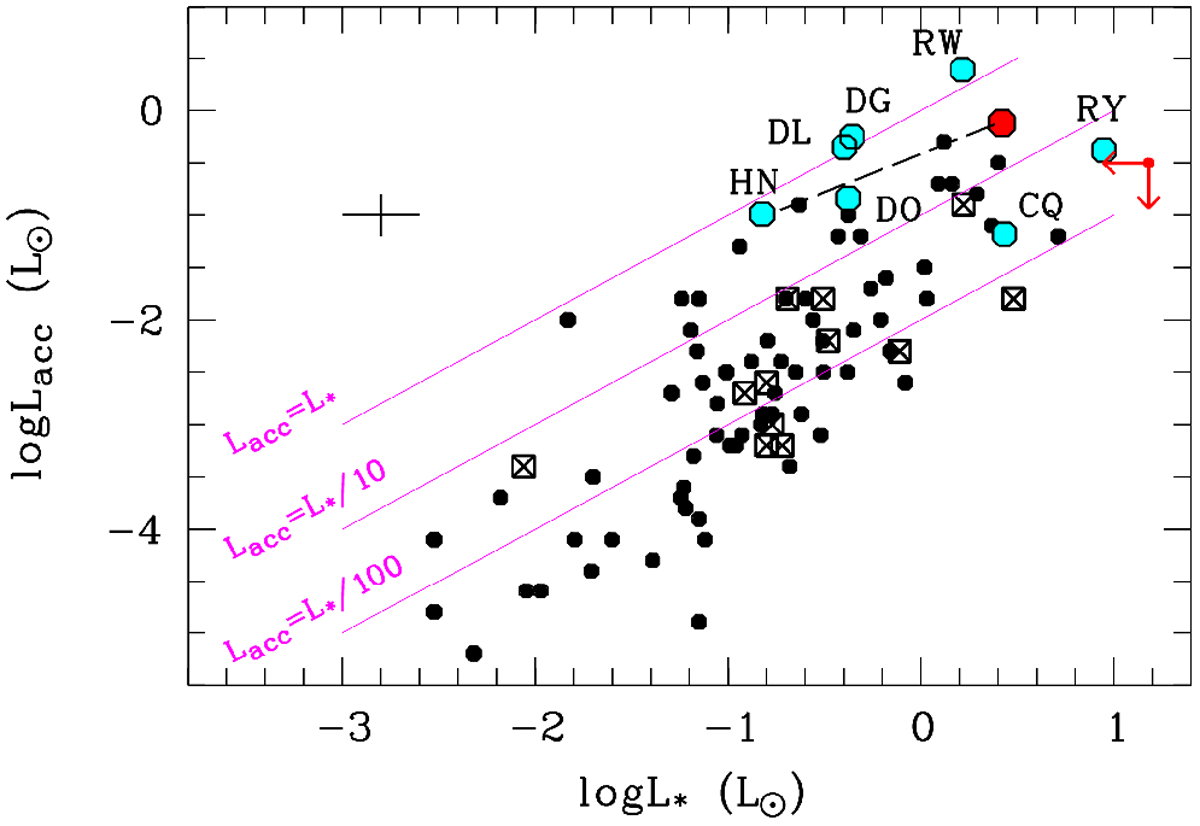
Accretion luminosity as a function of stellar luminosity for the stars in Lupus (black symbols) and the seven Taurus CTTs studied here (blue circles). The latter are labeled with their names. The Lupus transitional disks are shown with crossed squares. The continuous lines represent the three Lacc vs. L⋆ relations as labeled. The long-dashed line represents the shift of HN Tau A on the diagram when correcting its Lacc and L⋆ values for obscuration effects by the disk. The corrected values are shown with the red dot. The leftward and downward red arrows represent the upper limits on L⋆ and Lacc for CQ Tau, respectively. The average errors for the Taurus sample are shown in the upper left. Figure adapted from Alcalá et al. (2017).
Current usage metrics show cumulative count of Article Views (full-text article views including HTML views, PDF and ePub downloads, according to the available data) and Abstracts Views on Vision4Press platform.
Data correspond to usage on the plateform after 2015. The current usage metrics is available 48-96 hours after online publication and is updated daily on week days.
Initial download of the metrics may take a while.