Fig. 6
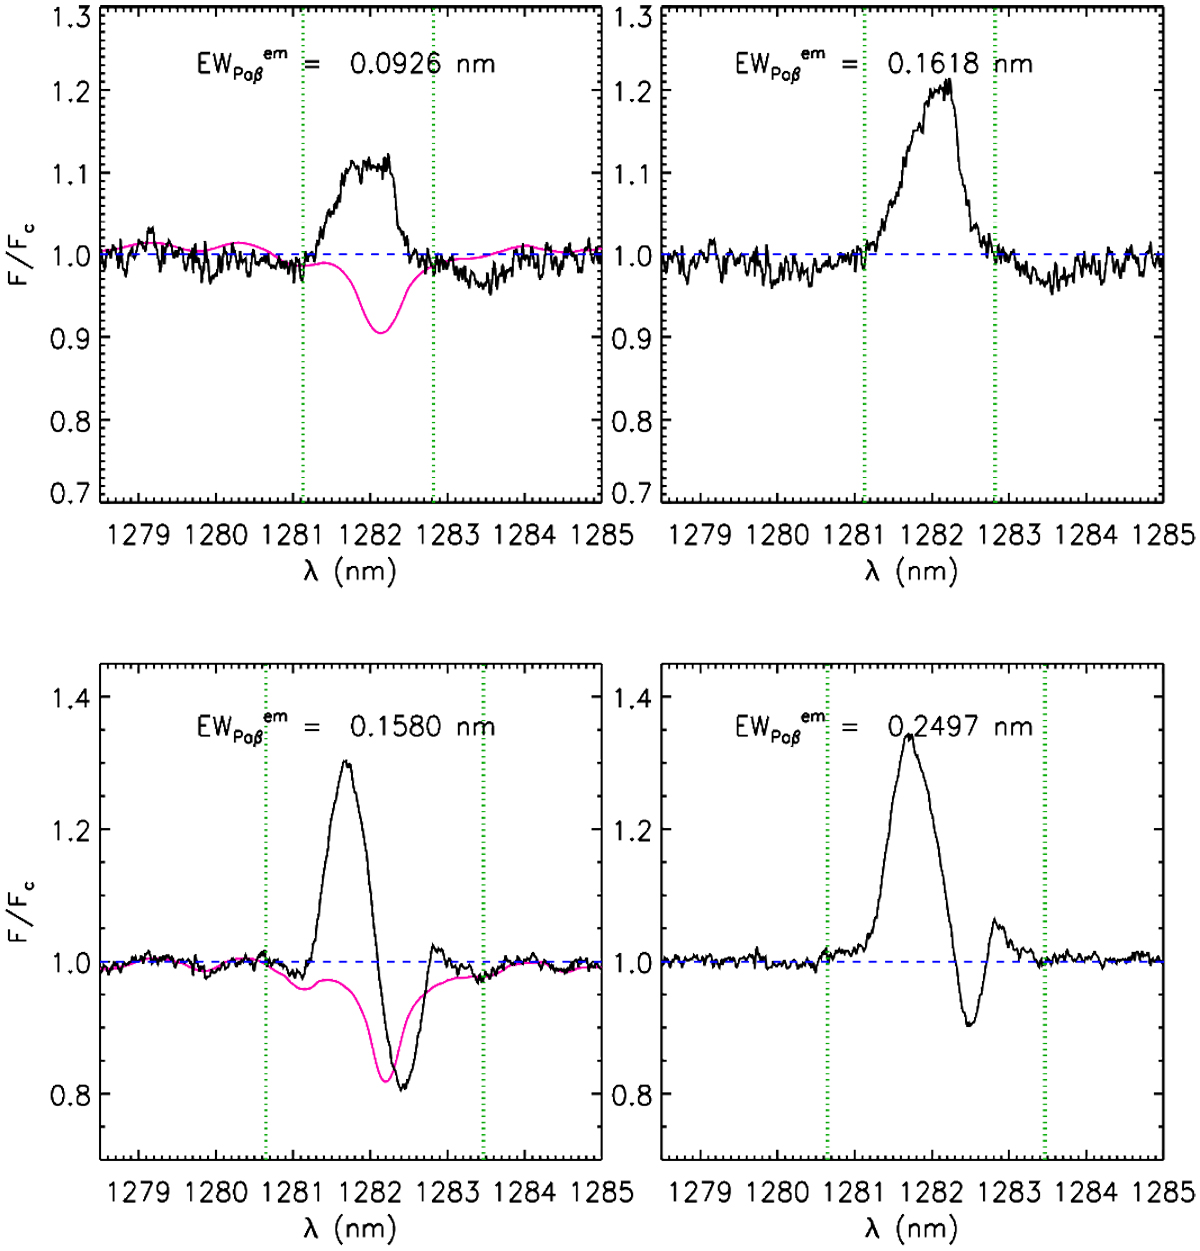
Examples of photospheric line subtraction for the Paβ line for CQ Tau (upper panels) and RY Tau (lower panels). The red lines represent the photospheric templates. The left and right panels show, in black lines, the observed and photospheric-subtracted spectra, respectively. The green vertical lines mark the intervals for the equivalent width measurement. The equivalent widths of the emission line before and after the subtraction are also indicated.
Current usage metrics show cumulative count of Article Views (full-text article views including HTML views, PDF and ePub downloads, according to the available data) and Abstracts Views on Vision4Press platform.
Data correspond to usage on the plateform after 2015. The current usage metrics is available 48-96 hours after online publication and is updated daily on week days.
Initial download of the metrics may take a while.