Free Access
Fig. 5
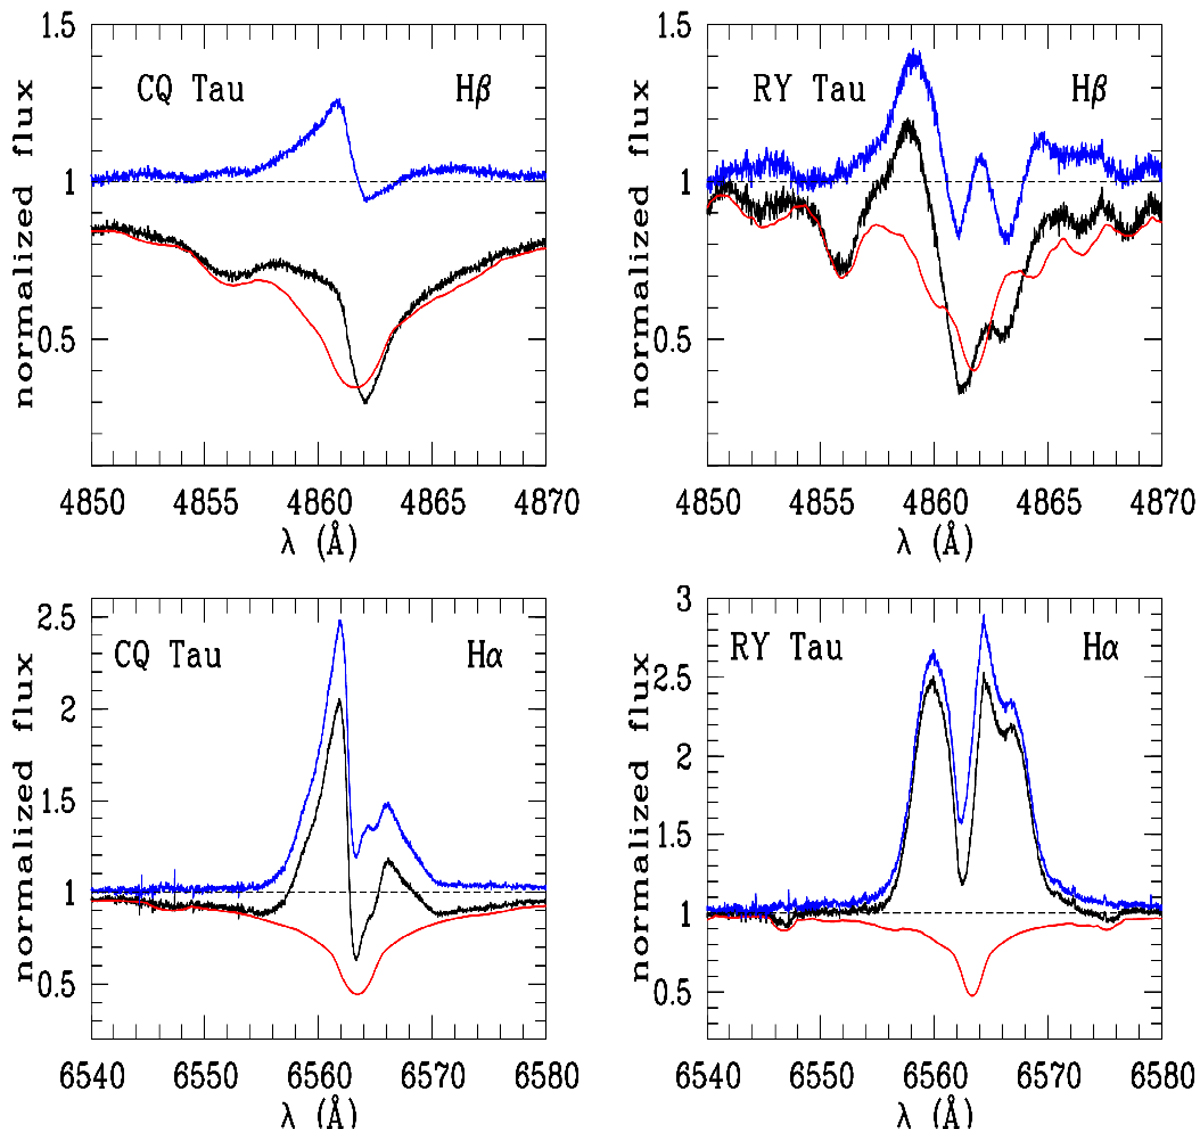
Examples of photospheric line subtraction for the Hα and Hβ lines in CQ Tau and RY Tau. The black, red, and blue lines represent the observed, photospheric, and photospheric-subtracted spectra, respectively. See text for details.
Current usage metrics show cumulative count of Article Views (full-text article views including HTML views, PDF and ePub downloads, according to the available data) and Abstracts Views on Vision4Press platform.
Data correspond to usage on the plateform after 2015. The current usage metrics is available 48-96 hours after online publication and is updated daily on week days.
Initial download of the metrics may take a while.