Fig. 1
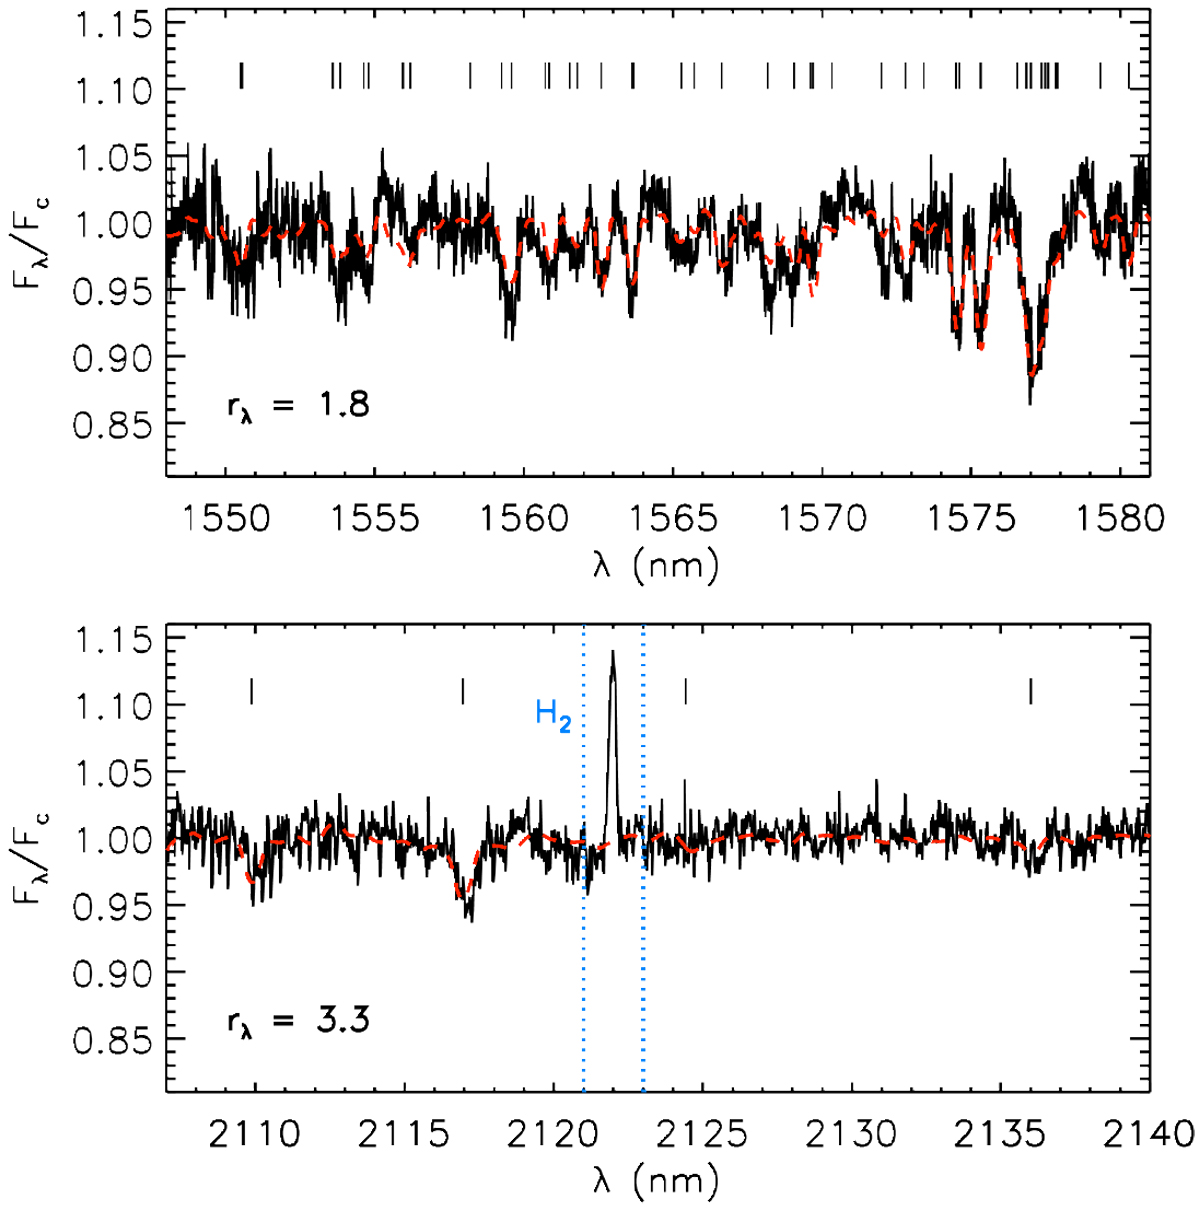
Two portions of the continuum-normalized spectrum of HN Tau A (black solid line) in the HK bands, with the rotationally broadened and veiled spectrum of the stellar template overplotted (red dashed line). Absorption features, mainly of the iron-peak group, are indicated with small vertical lines. We refer to Rayner et al. (2009) for the details on the absorption features. Emission lines such as the H2 line, indicated with the blue dotted lines, are excluded from the analysis. The value of veiling, which minimizes residuals with respectof the rotationally broadened and veiled template, is indicated in the lower left.
Current usage metrics show cumulative count of Article Views (full-text article views including HTML views, PDF and ePub downloads, according to the available data) and Abstracts Views on Vision4Press platform.
Data correspond to usage on the plateform after 2015. The current usage metrics is available 48-96 hours after online publication and is updated daily on week days.
Initial download of the metrics may take a while.