Fig. E.6
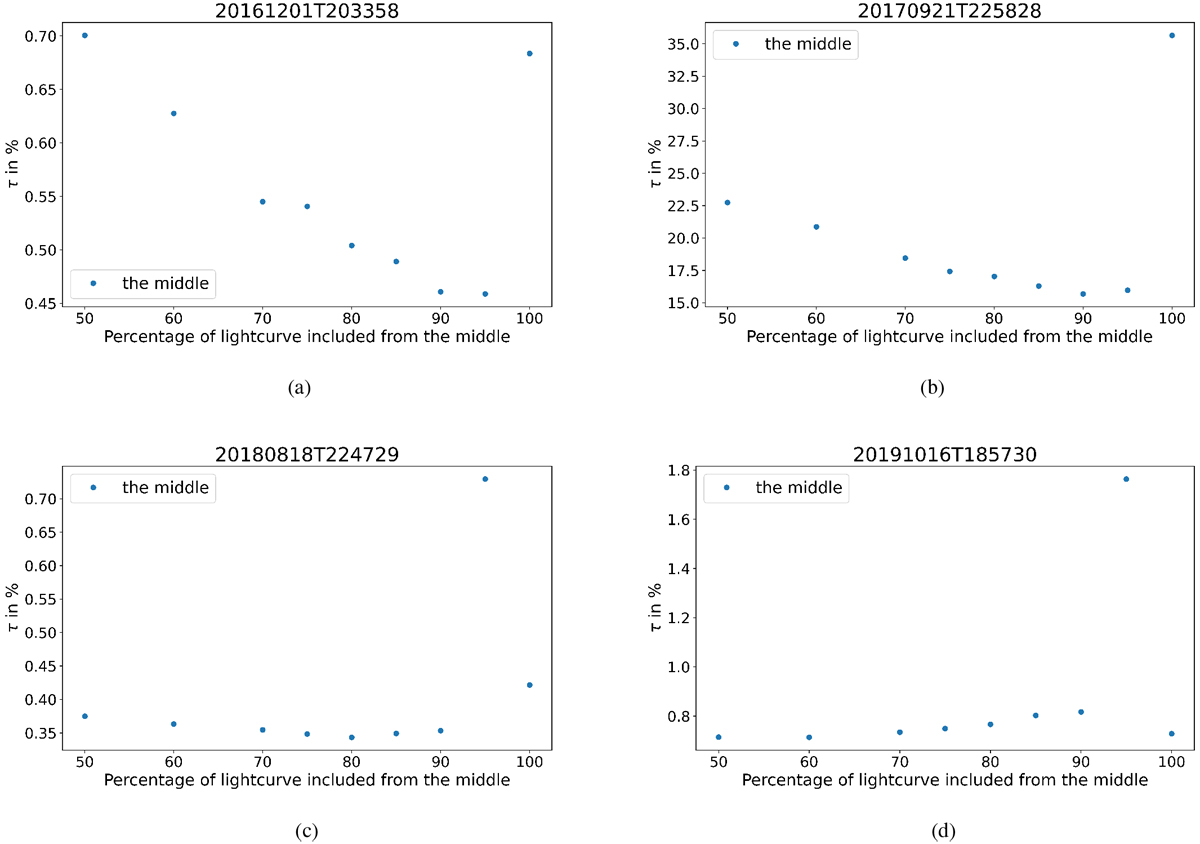
τ in percent of the simulated reduced events based on the four events listed in Table 1. The values are also listed in Table E.1. The x-axis displays the percentage of light curve that is included (100%, 95%, 90%, 85%, 80%, 75%, 70%, 60%, and 50%, respectively). In these cases, missing parts of the beginning and of the end of the trajectory were simulated, hence only the data of the middle of the trajectory is available: (a) Meteor from 1 December 2016 (faint and slow), (b) fireball from 21 September 2017 (bright and fast), (c) meteor from 18 August 2018 (faint and fast), and (d) fireball from 16 October 2019 (brightand slow).
Current usage metrics show cumulative count of Article Views (full-text article views including HTML views, PDF and ePub downloads, according to the available data) and Abstracts Views on Vision4Press platform.
Data correspond to usage on the plateform after 2015. The current usage metrics is available 48-96 hours after online publication and is updated daily on week days.
Initial download of the metrics may take a while.