Fig. E.2
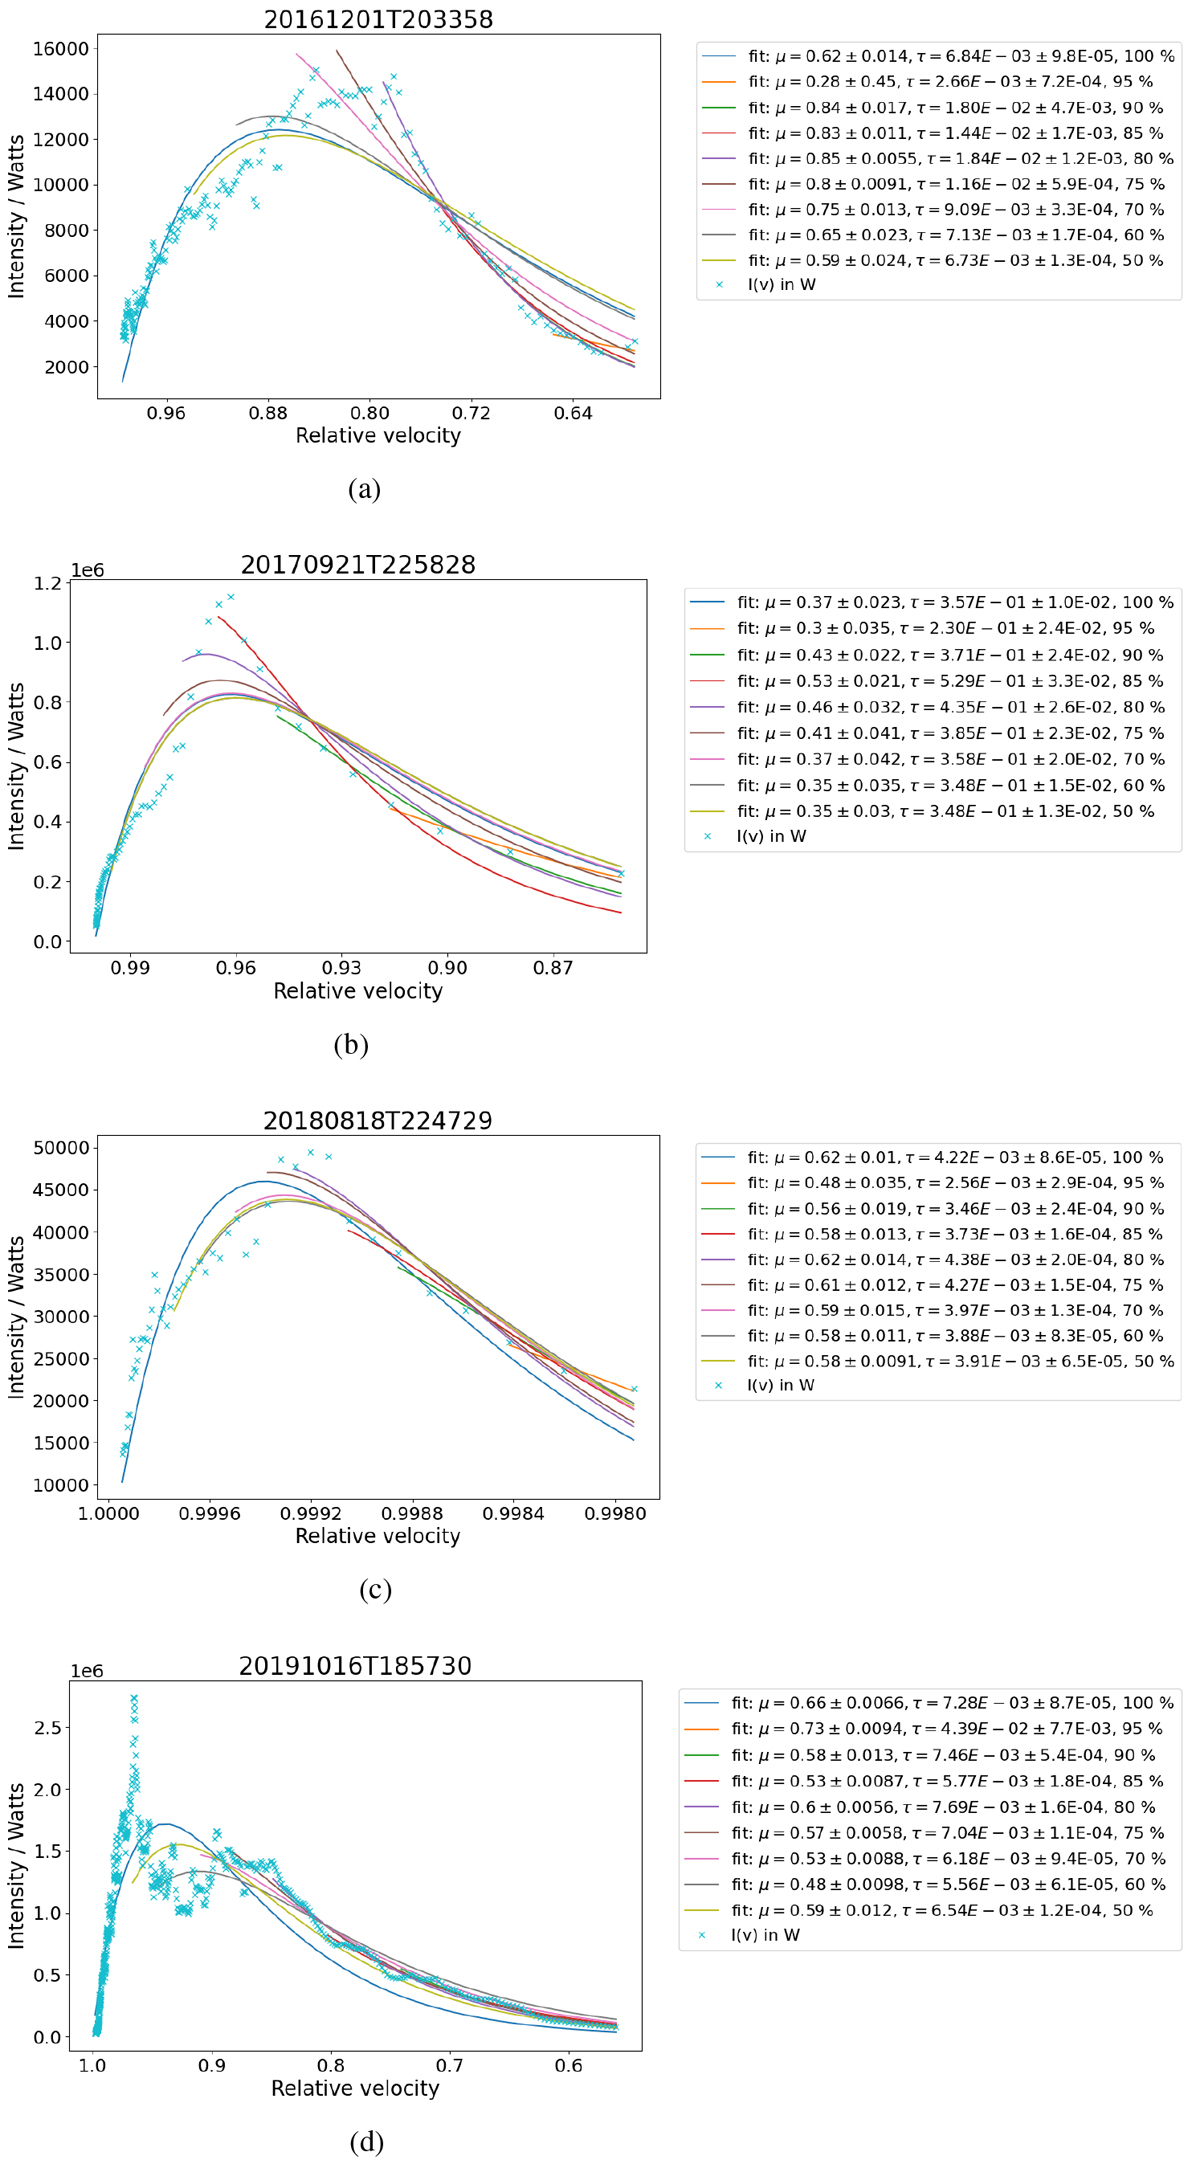
Light curves of the four events listed in Table 1 with applied fits to the simulated reduced events. In these cases missing parts of the beginning of the trajectory were simulated. The intensity data is presented as blue crosses and the colour-coded solid lines represent the results of the fit to the light curves for which part of the data, 100%, 95%, 90%, 85%, 80%, 75%, 70%, 60%, and 50%, respectively, is still included. (a) Meteor from 1 December 2016 (faint and slow), (b) fireball from 21 September 2017 (bright and fast), (c) meteor from 18 August 2018 (faint and fast), and (d) fireball from 16 October 2019 (bright and slow).
Current usage metrics show cumulative count of Article Views (full-text article views including HTML views, PDF and ePub downloads, according to the available data) and Abstracts Views on Vision4Press platform.
Data correspond to usage on the plateform after 2015. The current usage metrics is available 48-96 hours after online publication and is updated daily on week days.
Initial download of the metrics may take a while.