Fig. C.2
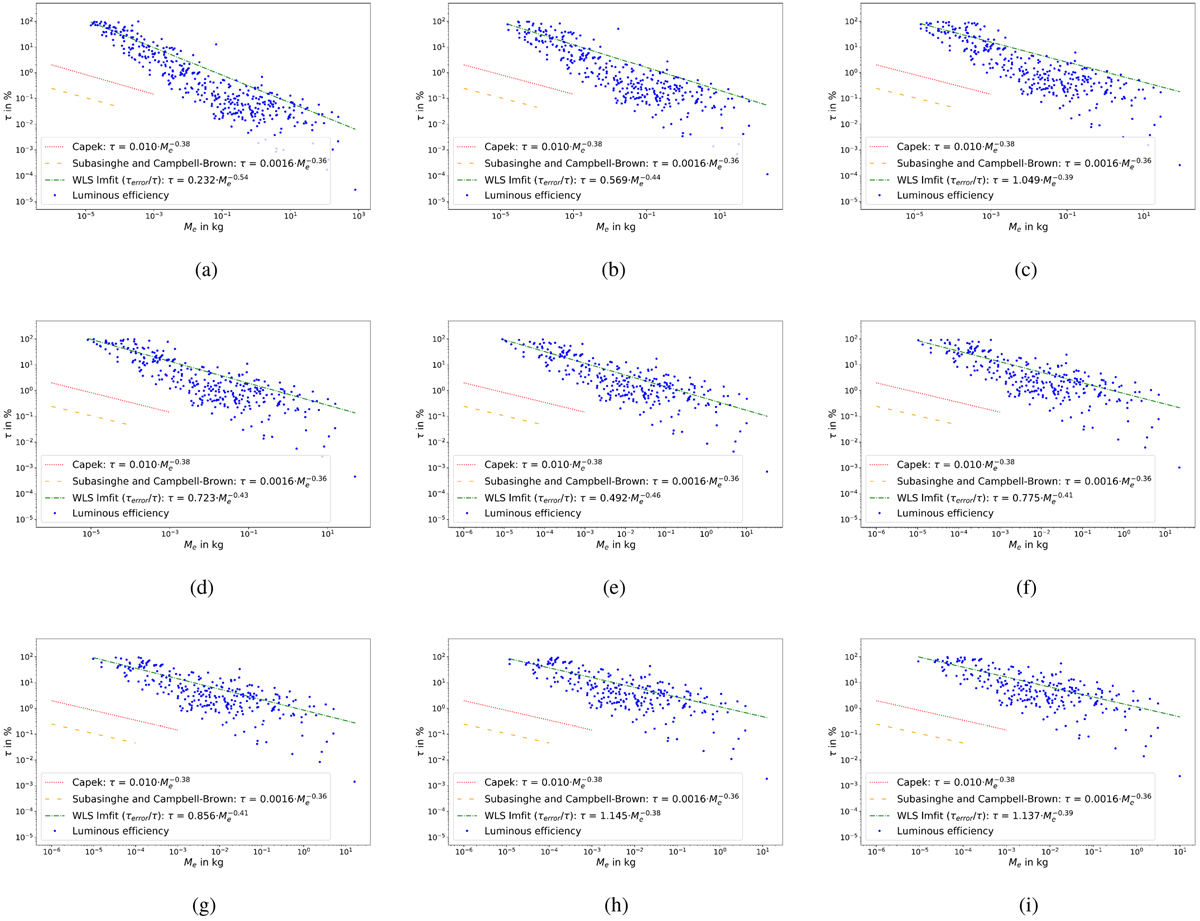
Distribution of the luminous efficiency τ in percent for different density assumptions: (a) ρ = 500 kg m−3; (b) ρ = 1000 kg m−3; (c) ρ = 1500 kg m−3; (d) ρ = 2000 kg m−3; (e) ρ = 2500 kg m−3; (f) ρ = 3000 kg m−3; (g) ρ = 3500 kg m−3; (h) ρ = 4000 kg m−3; (i) ρ = 4500 kg m−3. τ is plotted against the events corresponding pre-atmospheric meteoroid’s mass with a fit through the data in log-log space. These results were obtained from the dataset of 288 objects. Blue dots: values of τ; green dash-dotted line: weighted least squares fit (WLS) applied to the data, the method weights the values by the relative error of the value; red dotted line: the results found by Čapek et al. (2019); orange loosely dashed line: the results found by Subasinghe & Campbell-Brown (2018).
Current usage metrics show cumulative count of Article Views (full-text article views including HTML views, PDF and ePub downloads, according to the available data) and Abstracts Views on Vision4Press platform.
Data correspond to usage on the plateform after 2015. The current usage metrics is available 48-96 hours after online publication and is updated daily on week days.
Initial download of the metrics may take a while.