Fig. 15
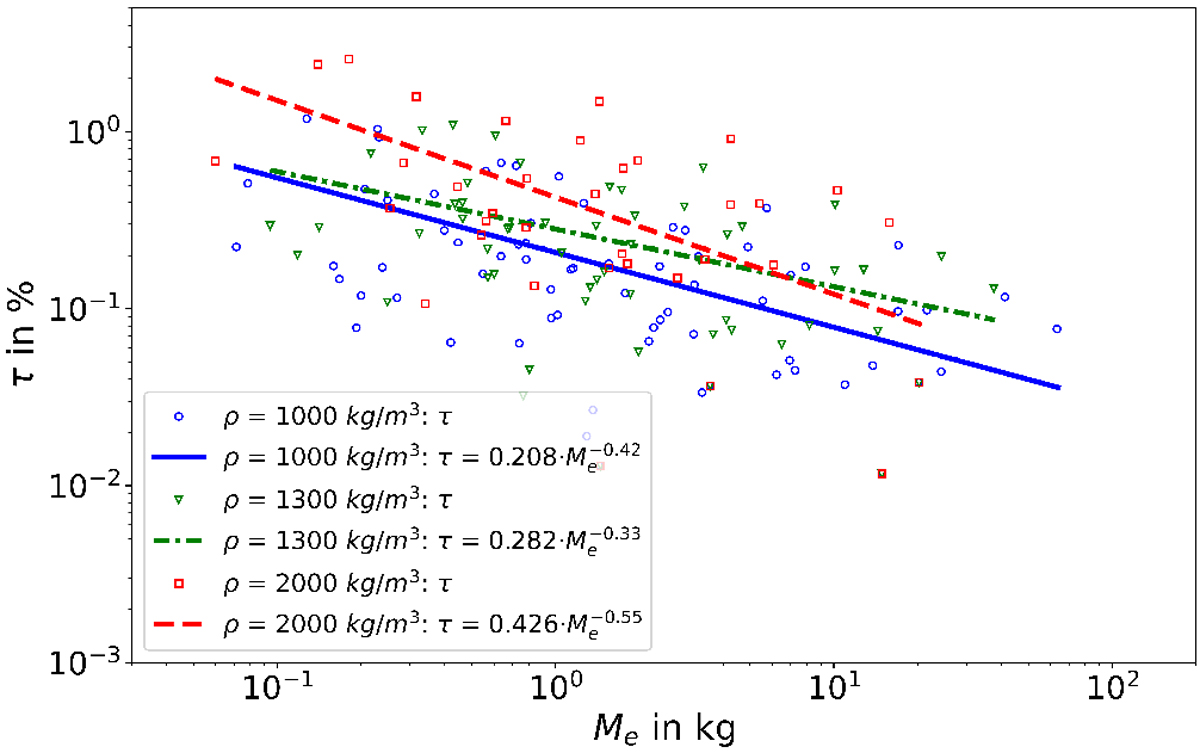
Luminous efficiencies of 54 events plotted over the objects’ pre-atmospheric masses with a fit through the data presented in log-log space. The events were selected according to the following criteria: (ve − vfinal)∕ve > 80%, hfinal < 70 km, and Kn < 0.01, and assuming three different sporadic densities; Blue circles: computed values of τ assuming ρSporadics = 1000 kg m−3 with weighted least squares fit (WLS) applied to the data (solid blue line); green triangles: (same as Fig. 14) computed values of τ assuming ρSporadics = 1300 kg m−3 with the WLS applied to the data (dash-dotted green line); Red boxes: computed values of τ assuming ρSporadics = 2000 kg m−3 with the WLS applied to the data (dashed red line).
Current usage metrics show cumulative count of Article Views (full-text article views including HTML views, PDF and ePub downloads, according to the available data) and Abstracts Views on Vision4Press platform.
Data correspond to usage on the plateform after 2015. The current usage metrics is available 48-96 hours after online publication and is updated daily on week days.
Initial download of the metrics may take a while.