Fig. 1
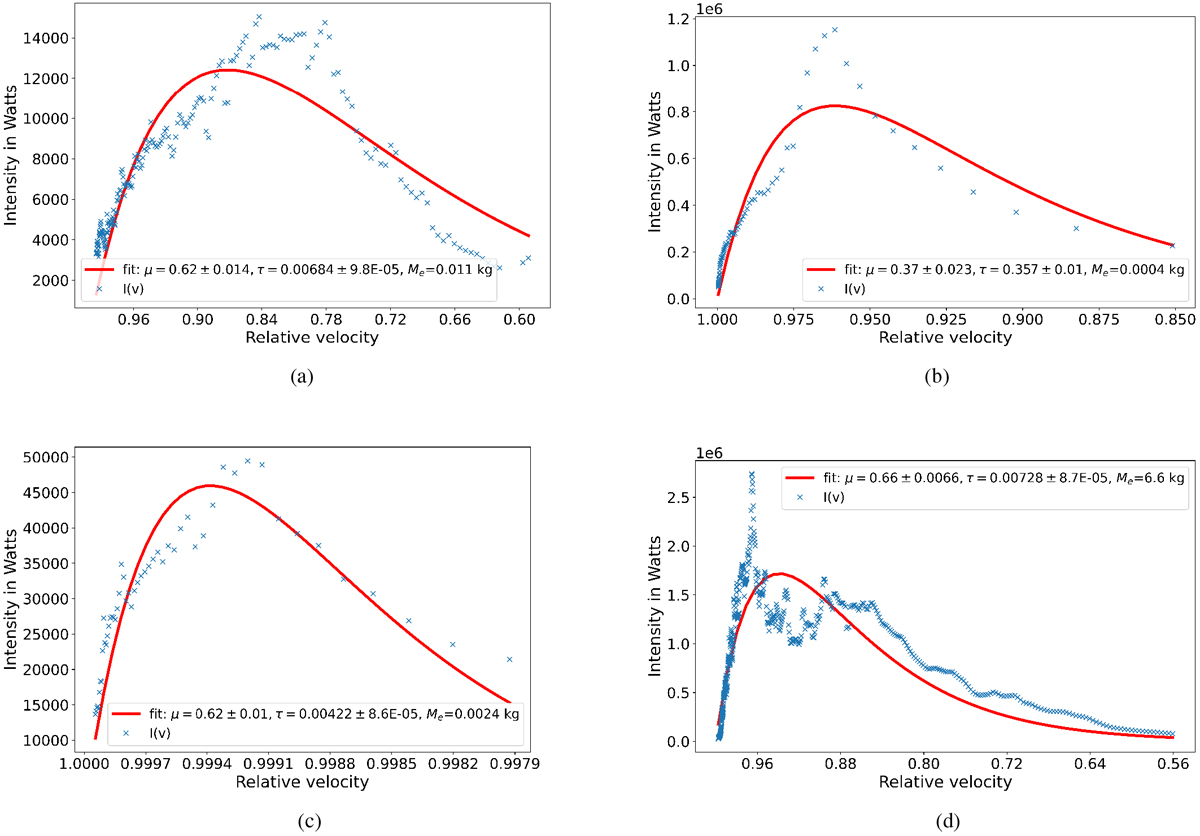
Computed light curves of the four exemplary FRIPON events presented in Table 1 with applied fit. The x-axis displays the relative velocity of the event for which each velocity value is divided by the event’s initial velocity. The brightness values are shown as blue ‘x’. The applied fit is displayed as a solid red line. (a) The meteor recorded on 1 December 2016 at 20:33:58 UT; (b) the fireball from 21 September 2017 at 22:58:28 UT; (c) the meteor detected on 18 August 2018 at 22:47:29 UT; (d) the fireball from 16 October 2019 at 18:57:30 UT.
Current usage metrics show cumulative count of Article Views (full-text article views including HTML views, PDF and ePub downloads, according to the available data) and Abstracts Views on Vision4Press platform.
Data correspond to usage on the plateform after 2015. The current usage metrics is available 48-96 hours after online publication and is updated daily on week days.
Initial download of the metrics may take a while.