Fig. 7.
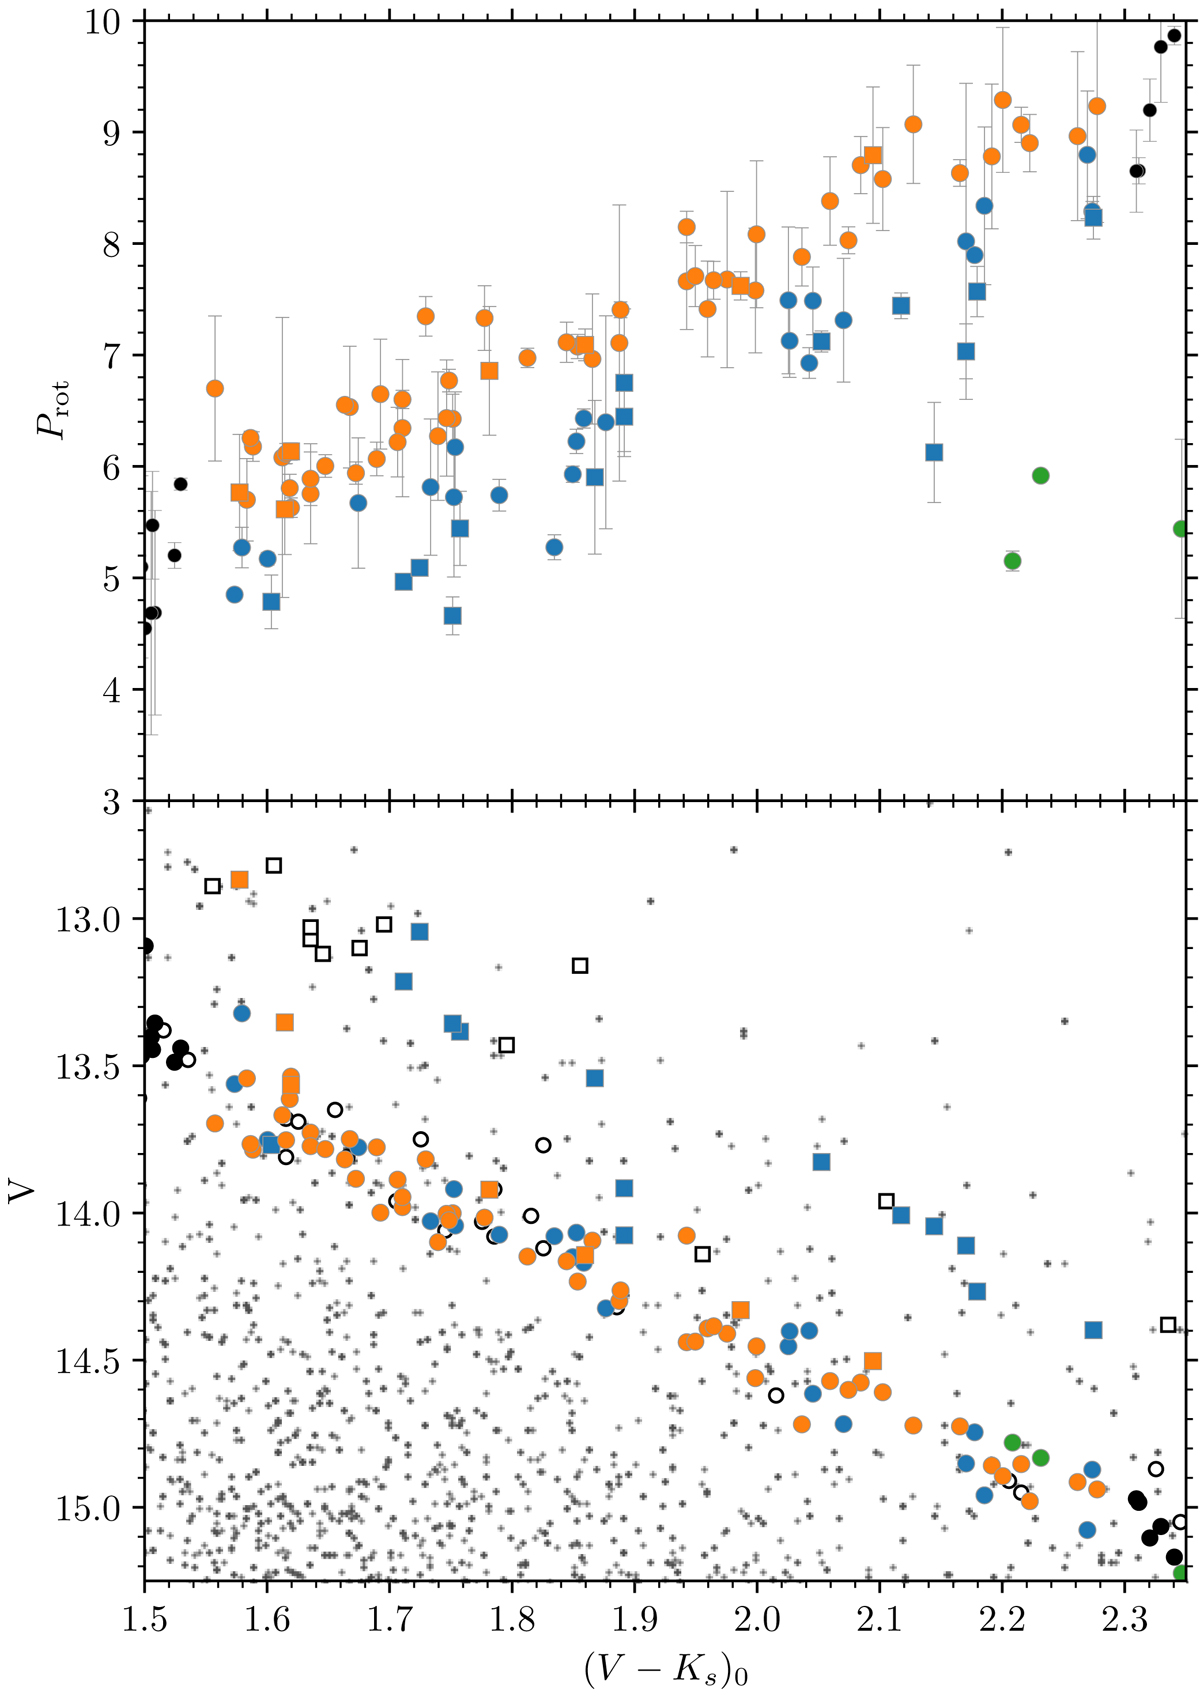
Top: zoom-in on the region of the colour-period diagram in which the bifurcation of the slow rotator sequence is observed. The longer-period sequence (S-slow rotators) is shown in orange and the shorter-period sequence (F-slow rotators) in blue. Additional slow rotators outside the region of interest are marked in black, and fast rotators in green. Squares indicate binaries. Bottom: corresponding colour-magnitude diagram (same symbols as above) with additional cluster members without determined rotation periods marked with open symbols. The equal-mass binary sequence is almost exclusively populated by the F-slow rotators, indicating a connection between faster rotation and binarity.
Current usage metrics show cumulative count of Article Views (full-text article views including HTML views, PDF and ePub downloads, according to the available data) and Abstracts Views on Vision4Press platform.
Data correspond to usage on the plateform after 2015. The current usage metrics is available 48-96 hours after online publication and is updated daily on week days.
Initial download of the metrics may take a while.