Fig. 4.
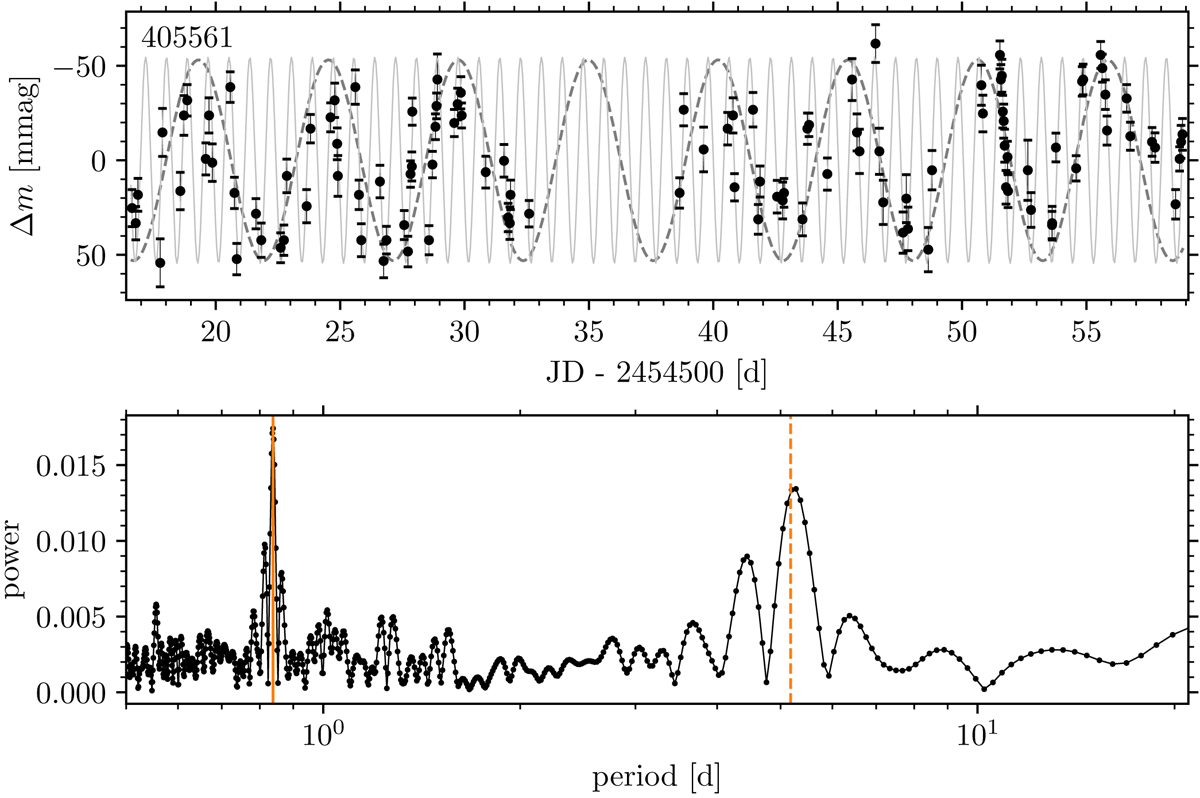
Top: example of a light curve with a strong alias. To guide the eye, sine waves for both the preferred period (Prot = 0.8385 d, solid line) and the alias period (Palias = 5.18 d, dashed line) are added to the data (black dots). The shorter period fits the data more closely as is shown by the fact that the simple sine connects nearly all data points. Bottom: corresponding CLEAN periodogram with both periods marked with vertical lines. The alias period is not located exactly at the peak in the periodogram due to the coarser resolution at longer periods.
Current usage metrics show cumulative count of Article Views (full-text article views including HTML views, PDF and ePub downloads, according to the available data) and Abstracts Views on Vision4Press platform.
Data correspond to usage on the plateform after 2015. The current usage metrics is available 48-96 hours after online publication and is updated daily on week days.
Initial download of the metrics may take a while.