Fig. A.1.
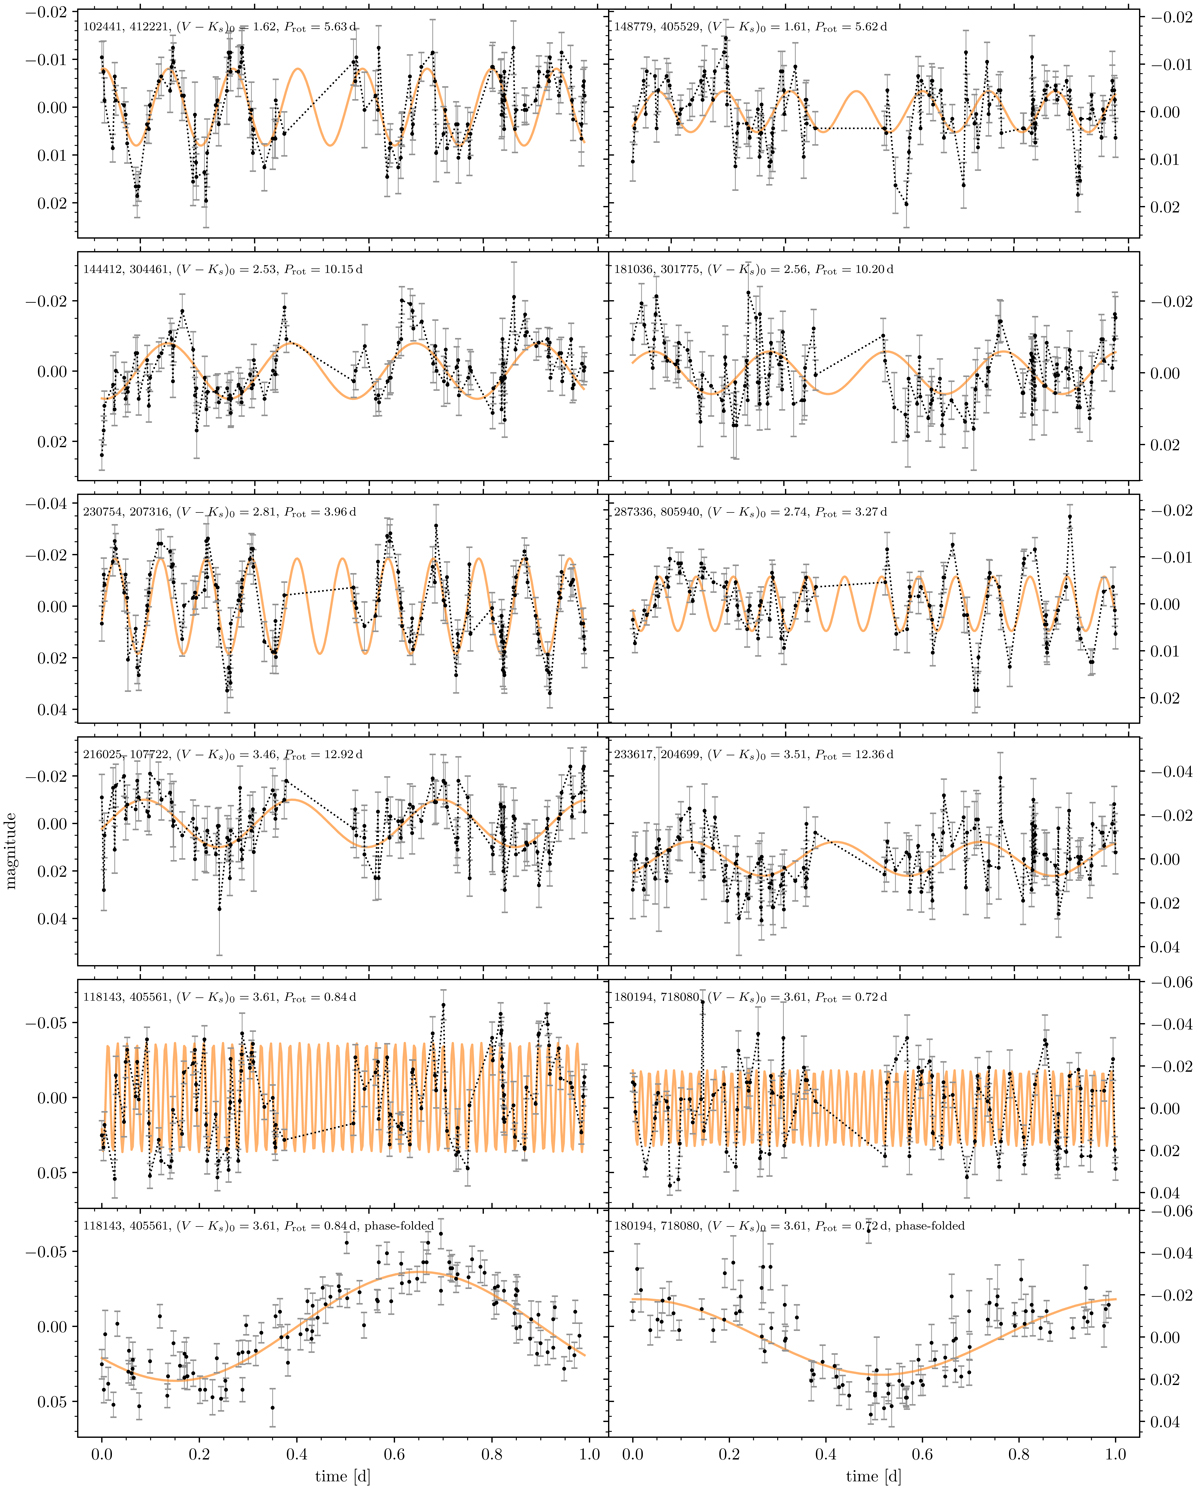
Examples of light curves with measured rotation periods. The stars are also marked in the CPD of Fig. 6. Left column: light curves classified as first class and right column: noisier algorithmic ones. Bottom row: features the phase-folded light curves of the fast rotators in the row immediately above. Each light curve is over-plotted with a sine of the same periodicity as our final rotation period. The ID numbers in each panel are from Clem et al. (2011) and F19.
Current usage metrics show cumulative count of Article Views (full-text article views including HTML views, PDF and ePub downloads, according to the available data) and Abstracts Views on Vision4Press platform.
Data correspond to usage on the plateform after 2015. The current usage metrics is available 48-96 hours after online publication and is updated daily on week days.
Initial download of the metrics may take a while.