Fig. 12.
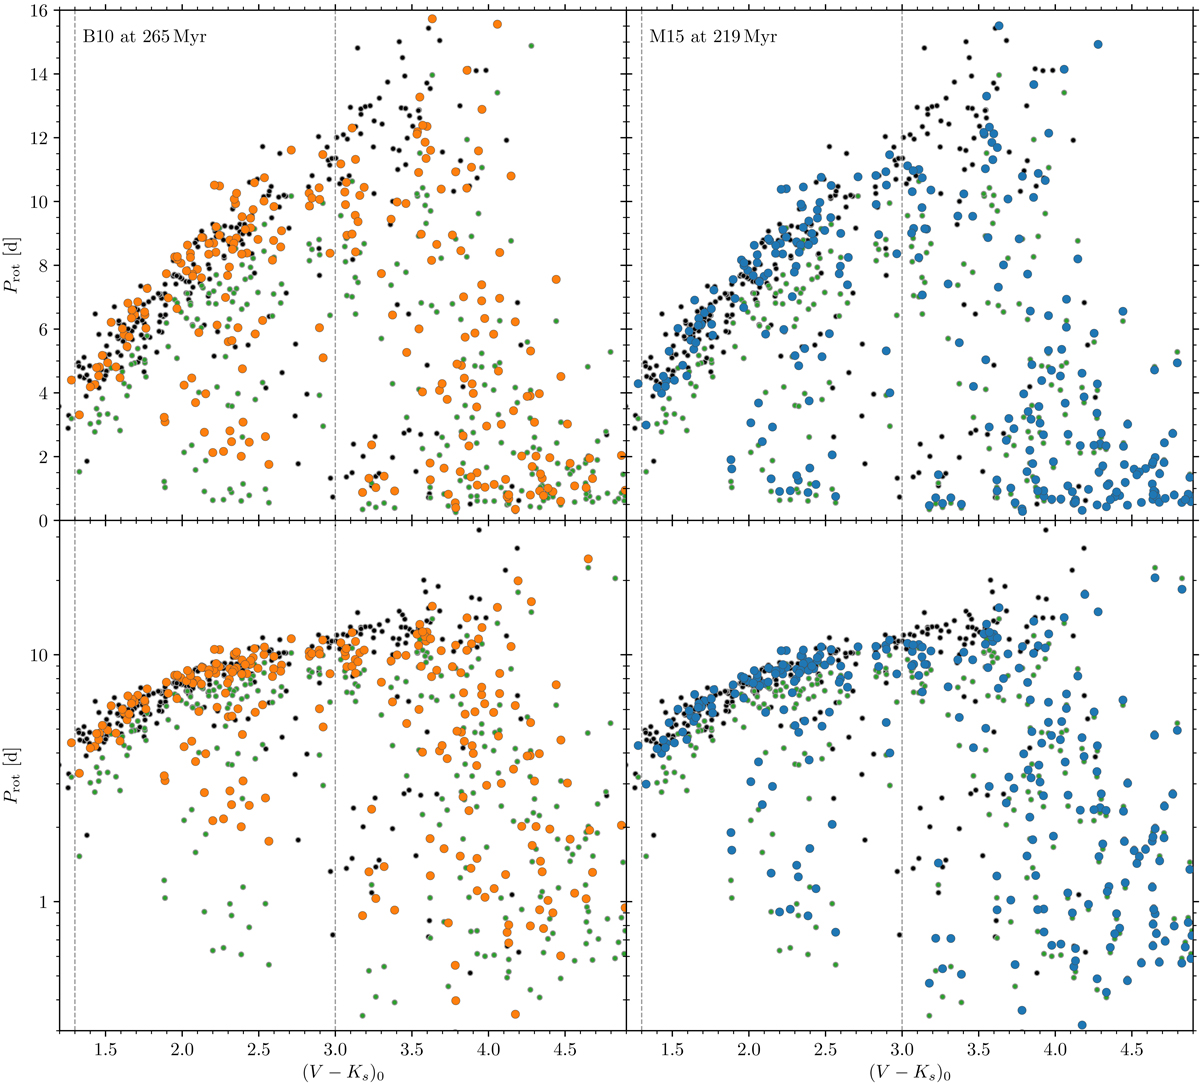
Comparison between the evolved rotation periods (orange and blue) with the observed NGC 3532 distribution (black). The starting distribution is that of NGC 2516 (green) and the models aim to match the observed NGC 3532 rotation periods. Left: evolution to 265 Myr with the B10 model. We see that, although the fast rotators in the NGC 2516 distribution spin down significantly, the spin-down in the B10 model is still not aggressive enough to transform them to the fast rotator sequence of NGC 3532 or sufficiently close to it. Right: evolution to 219 Myr with the M15 model. The transition from fast to slow rotation seems to be even more strongly underestimated, with the fast rotators of the NGC 2516 distribution not having evolved significantly upwards at all. We note that the lowest-mass stars of the NGC 2516 sample, which are still on the pre-main sequence, have spun up due to contraction. The vertical dashed lines in all panels indicate the colour range used to calculate the best-fitting slow rotator model. In this range both models represent the slow rotators of the target distribution equally well. Lower panels: (logarithmic in period) full period range, upper panels: restricted Prot < 16 d.
Current usage metrics show cumulative count of Article Views (full-text article views including HTML views, PDF and ePub downloads, according to the available data) and Abstracts Views on Vision4Press platform.
Data correspond to usage on the plateform after 2015. The current usage metrics is available 48-96 hours after online publication and is updated daily on week days.
Initial download of the metrics may take a while.