Fig. 8.
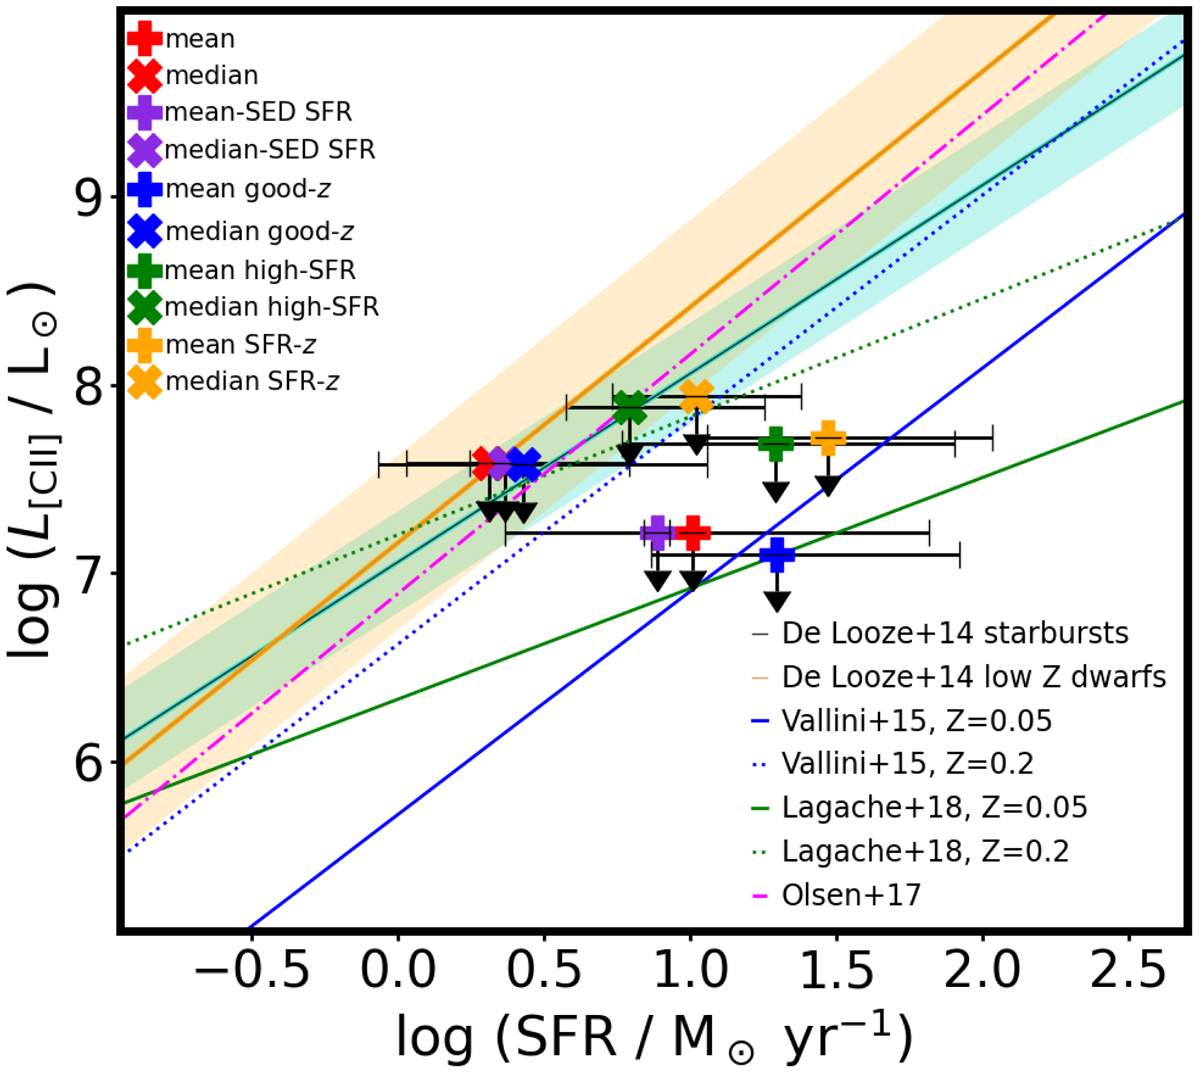
Stacking results, upper limit L[CII] vs. SFR compared to several models in the literature. The error bars are the standard deviation in the case of the mean stacking analyses, and the median absolute deviation for the median stacking analyses (for the SFR obtained from mean and median SED the errors are the errors extracted from the SED fitting). Models are extracted from the following studies: Vallini et al. (2015), Olsen et al. (2017), Lagache et al. (2018). Relations derived from low-z data come from De Looze et al. (2014), shown in cyan and orange, including their 1σ dispersion.
Current usage metrics show cumulative count of Article Views (full-text article views including HTML views, PDF and ePub downloads, according to the available data) and Abstracts Views on Vision4Press platform.
Data correspond to usage on the plateform after 2015. The current usage metrics is available 48-96 hours after online publication and is updated daily on week days.
Initial download of the metrics may take a while.