Fig. 7.
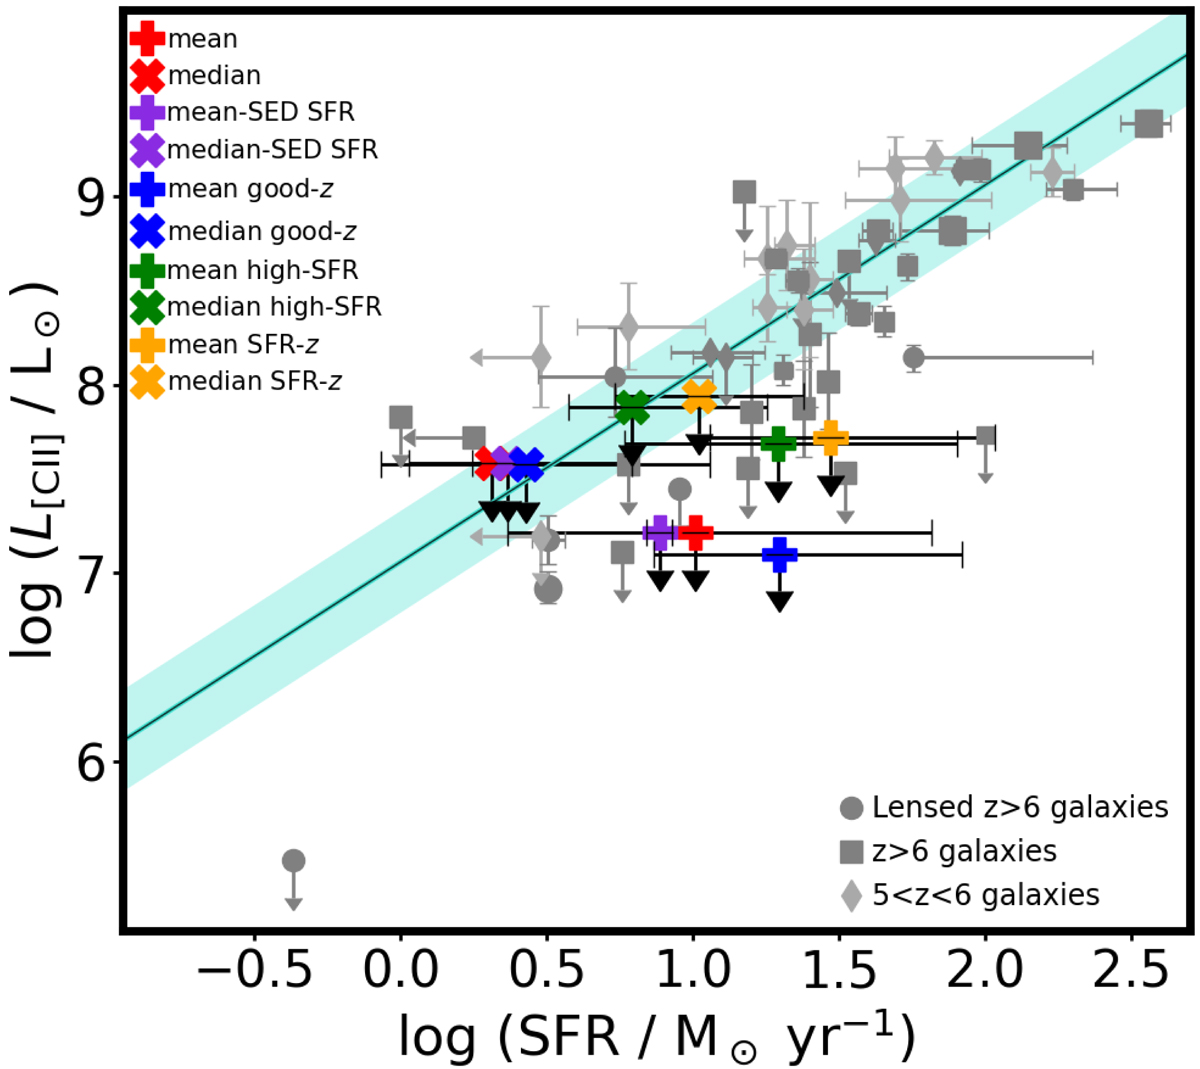
Stacking results, upper limit L[CII] vs. SFR. The error bars of the data obtained in this study are the standard deviation in the case of the mean stacking analyses, and the median absolute deviation for 8. The median stacking analyses (for the SFR obtained from mean and median SED the errors are the errors extracted from the SED fitting). Other data points are extracted from the following studies: Ouchi et al. (2013), Ota et al. (2014), González-López et al. (2014), Capak et al. (2015), Maiolino et al. (2015), Schaerer et al. (2015), Willott et al. (2015), Knudsen et al. (2016), Pentericci et al. (2016), Bradač et al. (2017), Decarli et al. (2017), Matthee et al. (2017), Carniani et al. (2018), Smit et al. (2018), Hashimoto et al. (2019), Béthermin et al. (2020), Bakx et al. (2020), Harikane et al. (2020), Fujimoto et al. (2021). The cyan line is the relation extracted for low-z starburst galaxies from the De Looze et al. (2014) study including its 1σ dispersion.
Current usage metrics show cumulative count of Article Views (full-text article views including HTML views, PDF and ePub downloads, according to the available data) and Abstracts Views on Vision4Press platform.
Data correspond to usage on the plateform after 2015. The current usage metrics is available 48-96 hours after online publication and is updated daily on week days.
Initial download of the metrics may take a while.