Free Access
Fig. 5.
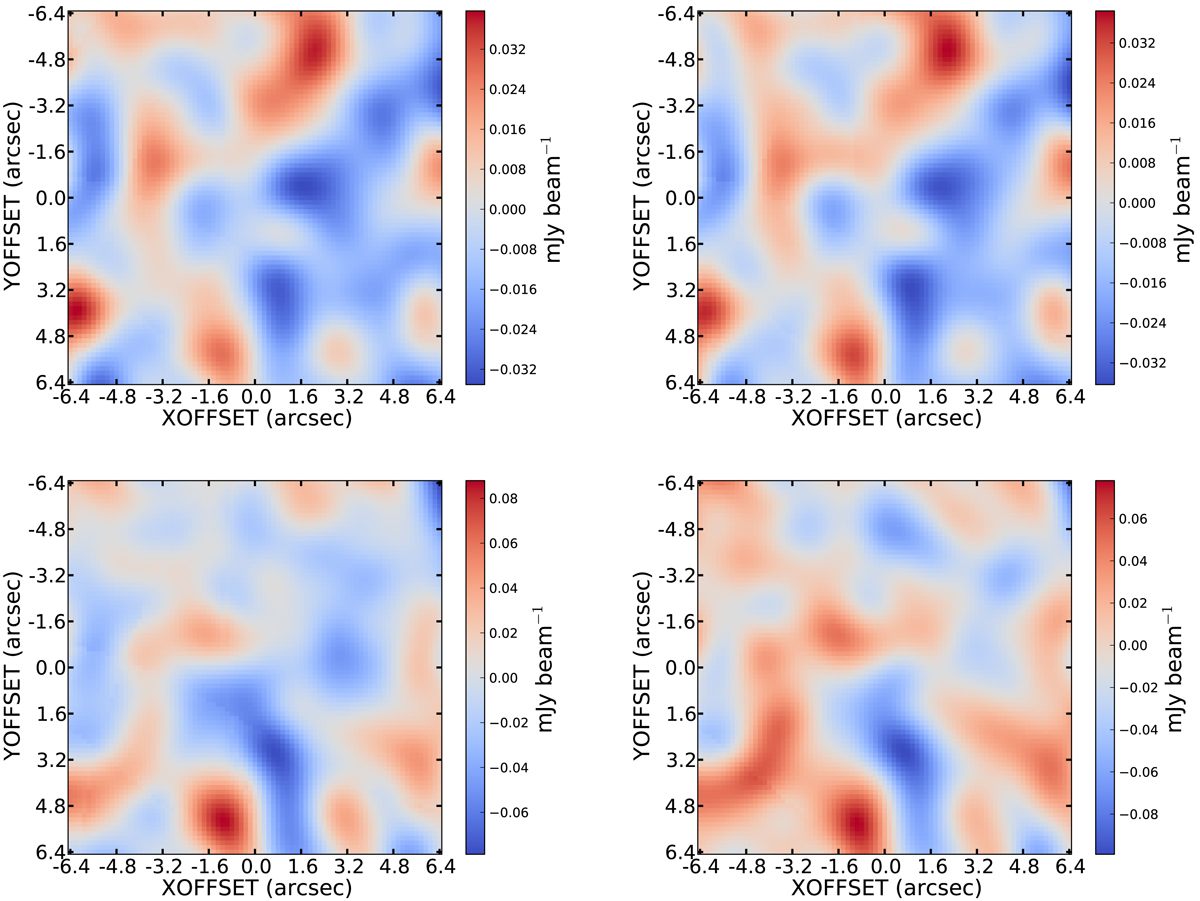
Continuum maps of the weighted-average continuum stacks. The artificial arcs featured on the sides of the figure are due to stacked sources located close to the edge of the cubes. From left to right and top to bottom, full-sample, Good-z sub-sample, High-SFR sub-sample and SFR+z sub-sample.
Current usage metrics show cumulative count of Article Views (full-text article views including HTML views, PDF and ePub downloads, according to the available data) and Abstracts Views on Vision4Press platform.
Data correspond to usage on the plateform after 2015. The current usage metrics is available 48-96 hours after online publication and is updated daily on week days.
Initial download of the metrics may take a while.